
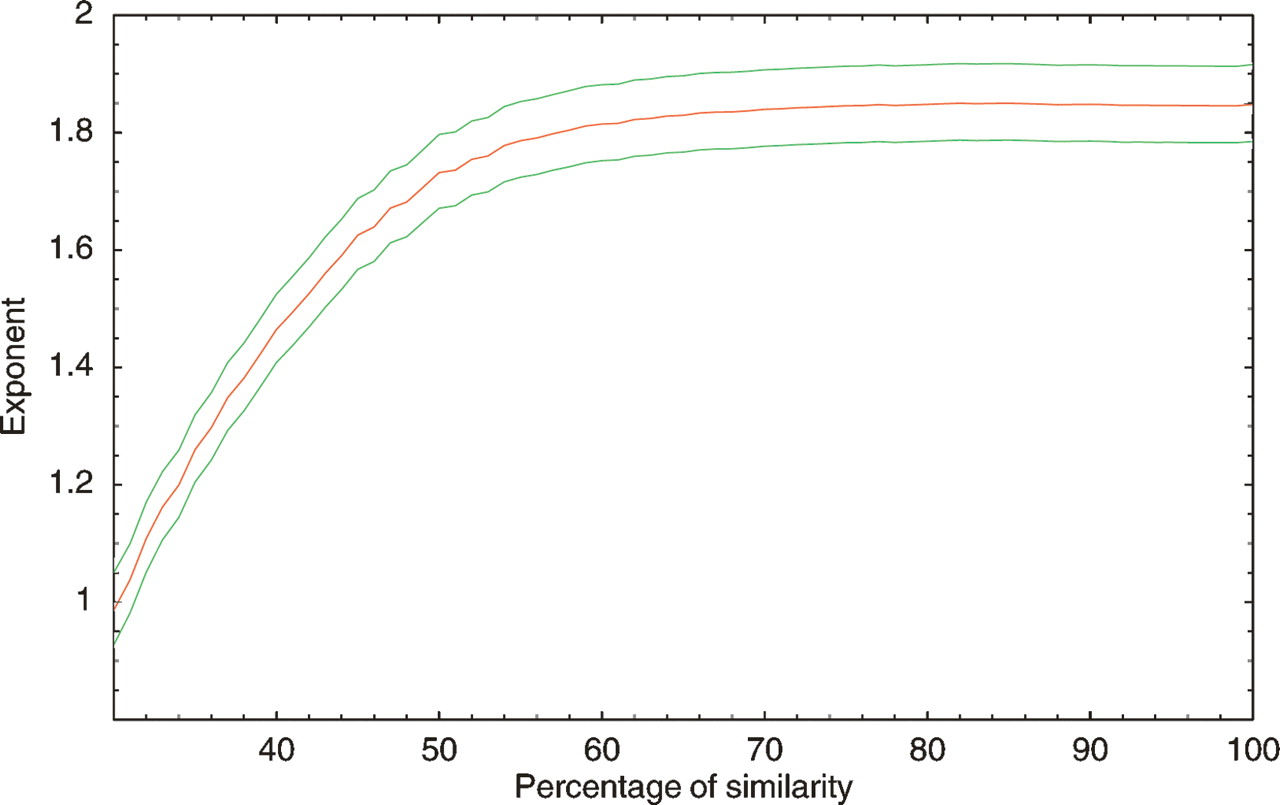
Figure 6.
Fitted exponent (vertical axis) for the number of DNA binding domain clusters as a function of genome size for different similarity cutoffs (horizontal axis). For a given similarity p we clustered all TFs in each genome whose DNA binding domains had a similarity of at least p percent. We then fitted the number of clusters as a function of the total number of genes in the genome to a power-law. The fitted exponent is shown as the red line, with the green lines indicating the 95% posterior probability interval.


