
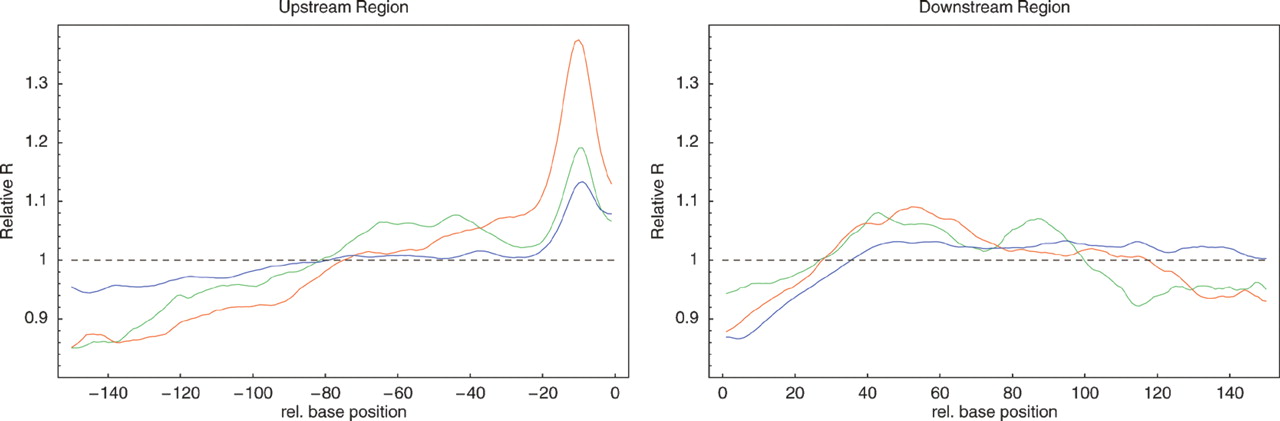
Figure 5.
Relative average R values upstream of and downstream from genes as in the left panel of Figure 4 but now averaged separately over genomes with <2000 genes (green), genomes with between 2000 and 4500 genes (red), and genomes with >4500 genes (blue). In order to compare the shapes of the R value profiles the values on the vertical axis are scaled to have a mean of 1 when averaged over the 150 bp upstream and when averaged over the 150 bp downstream.


