
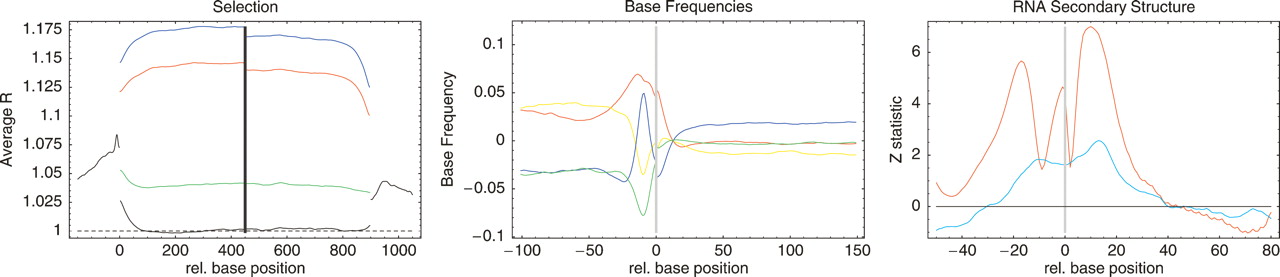
Universal position-dependent profiles in selection, base frequencies, and secondary structure as a function of position relative to translation start (position 0) and, in the left panel, stop (position 900). Statistics are averaged over all 22 clades in each panel. Left panel: R value profile averaged over all clades for first (red), second (blue), and third (green) positions in codons as well as intergenic/silent positions (black). Middle panel: Relative base frequencies, i.e., A (red), C (green), G (blue), and T (yellow) around translation start, averaged over all clades. Right panel: z-statistics for the probability of a given position to be unpaired relative to the average over the regions (−50,−31) and (31,80) (red) and relative to synthetic sequences with the same base composition (blue).


