
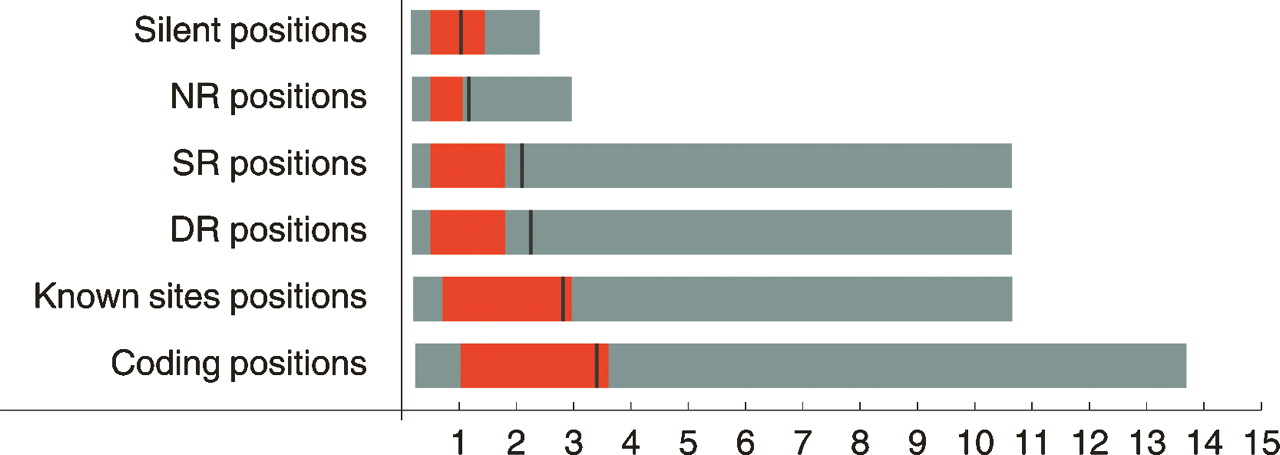
Figure 2.
Distributions of R values in different classes of positions in E. coli. For each category of positions the black line denotes the average R value, the red bar the 25–75 percentile, and the gray bar the 5–95 percentile.


