
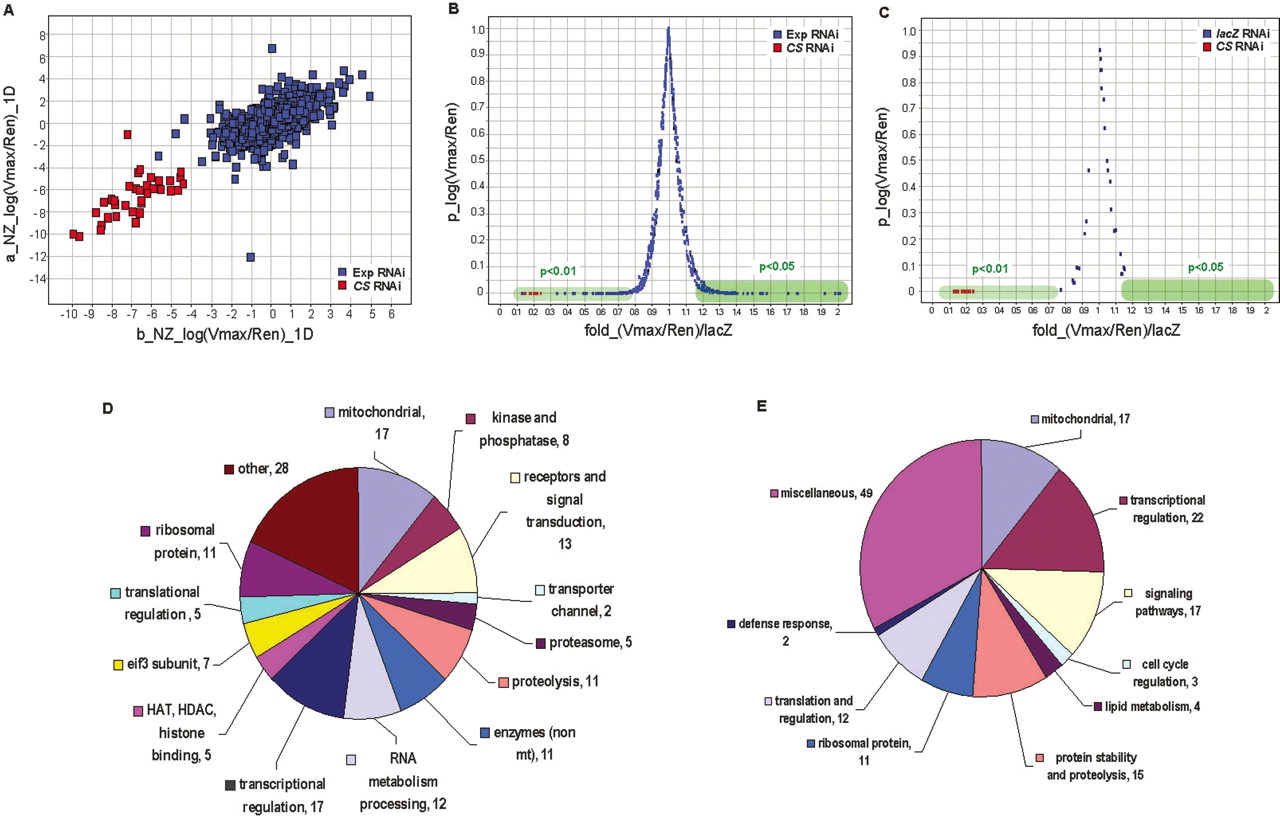
Whole genome RNAi screen. (A) The scatter plot shows the data from the first 12 duplicated plates of the primary screen. The X- and Y-axes represent NZ1D for replica b and replica a, respectively. Each spot represents the result of one dsRNA. The Citrate synthase dsRNA concentration was used as 5 μg/mL. “Exp RNAi” indicates experimental RNAi, “CS RNAi” indicates control Citrate synthase RNAi. (B) The result of confirmation screen for the primary hits. The X-axis represents average fold change of normalized CS activity induced by a dsRNA (six replicates) against the lacZ RNAi controls. The Y-axis represents P-value. Hits were selected based on their P-values against lacZ RNAi controls. The hits that negatively affect CS activities (their RNAi result in an increase in CS activity) were selected if their P < 0.05. The hits that positively affect CS activities (their RNAi result in a decrease in CS activity) were selected if their P < 0.01. The Citrate synthase dsRNA concentration was the same as in A. (C) The distribution of the lacZ RNAi controls in the confirmation screen as shown in B. (D) The classification of the confirmed hits by their molecular functions. (E) The classification of the confirmed hits by their biological processes and pathways.


