
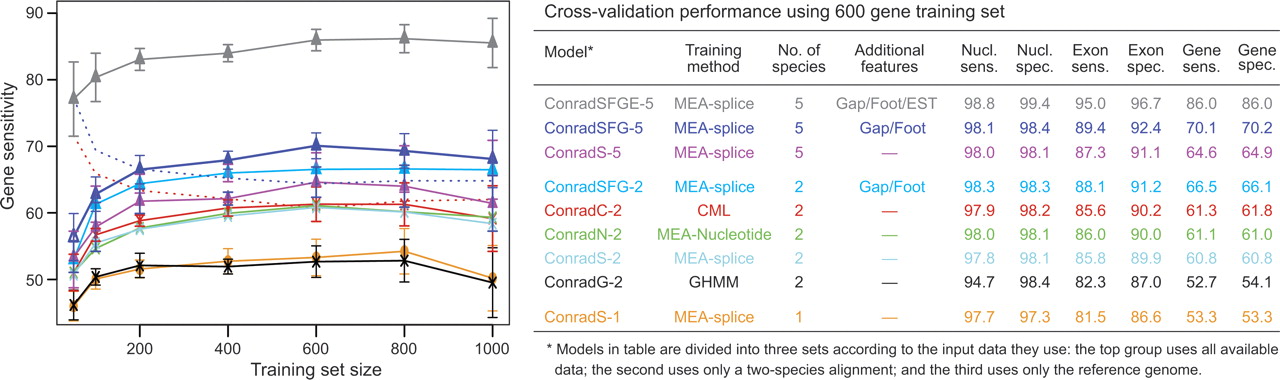
Figure 1.
Performance of Conrad models in the C. neoformans cross-validation tests. The graph on the left shows average gene sensitivity (percentage of reference genes completely correct in the testing set) across 10 replicates based on model and training set size. Solid lines are performance on the test set, and dotted lines are performance on the training set (not all training sets are shown). The bars represent standard deviation across the replicates. The table on the right shows the full set of testing accuracy statistics for the models on the 600-gene training sets.


