
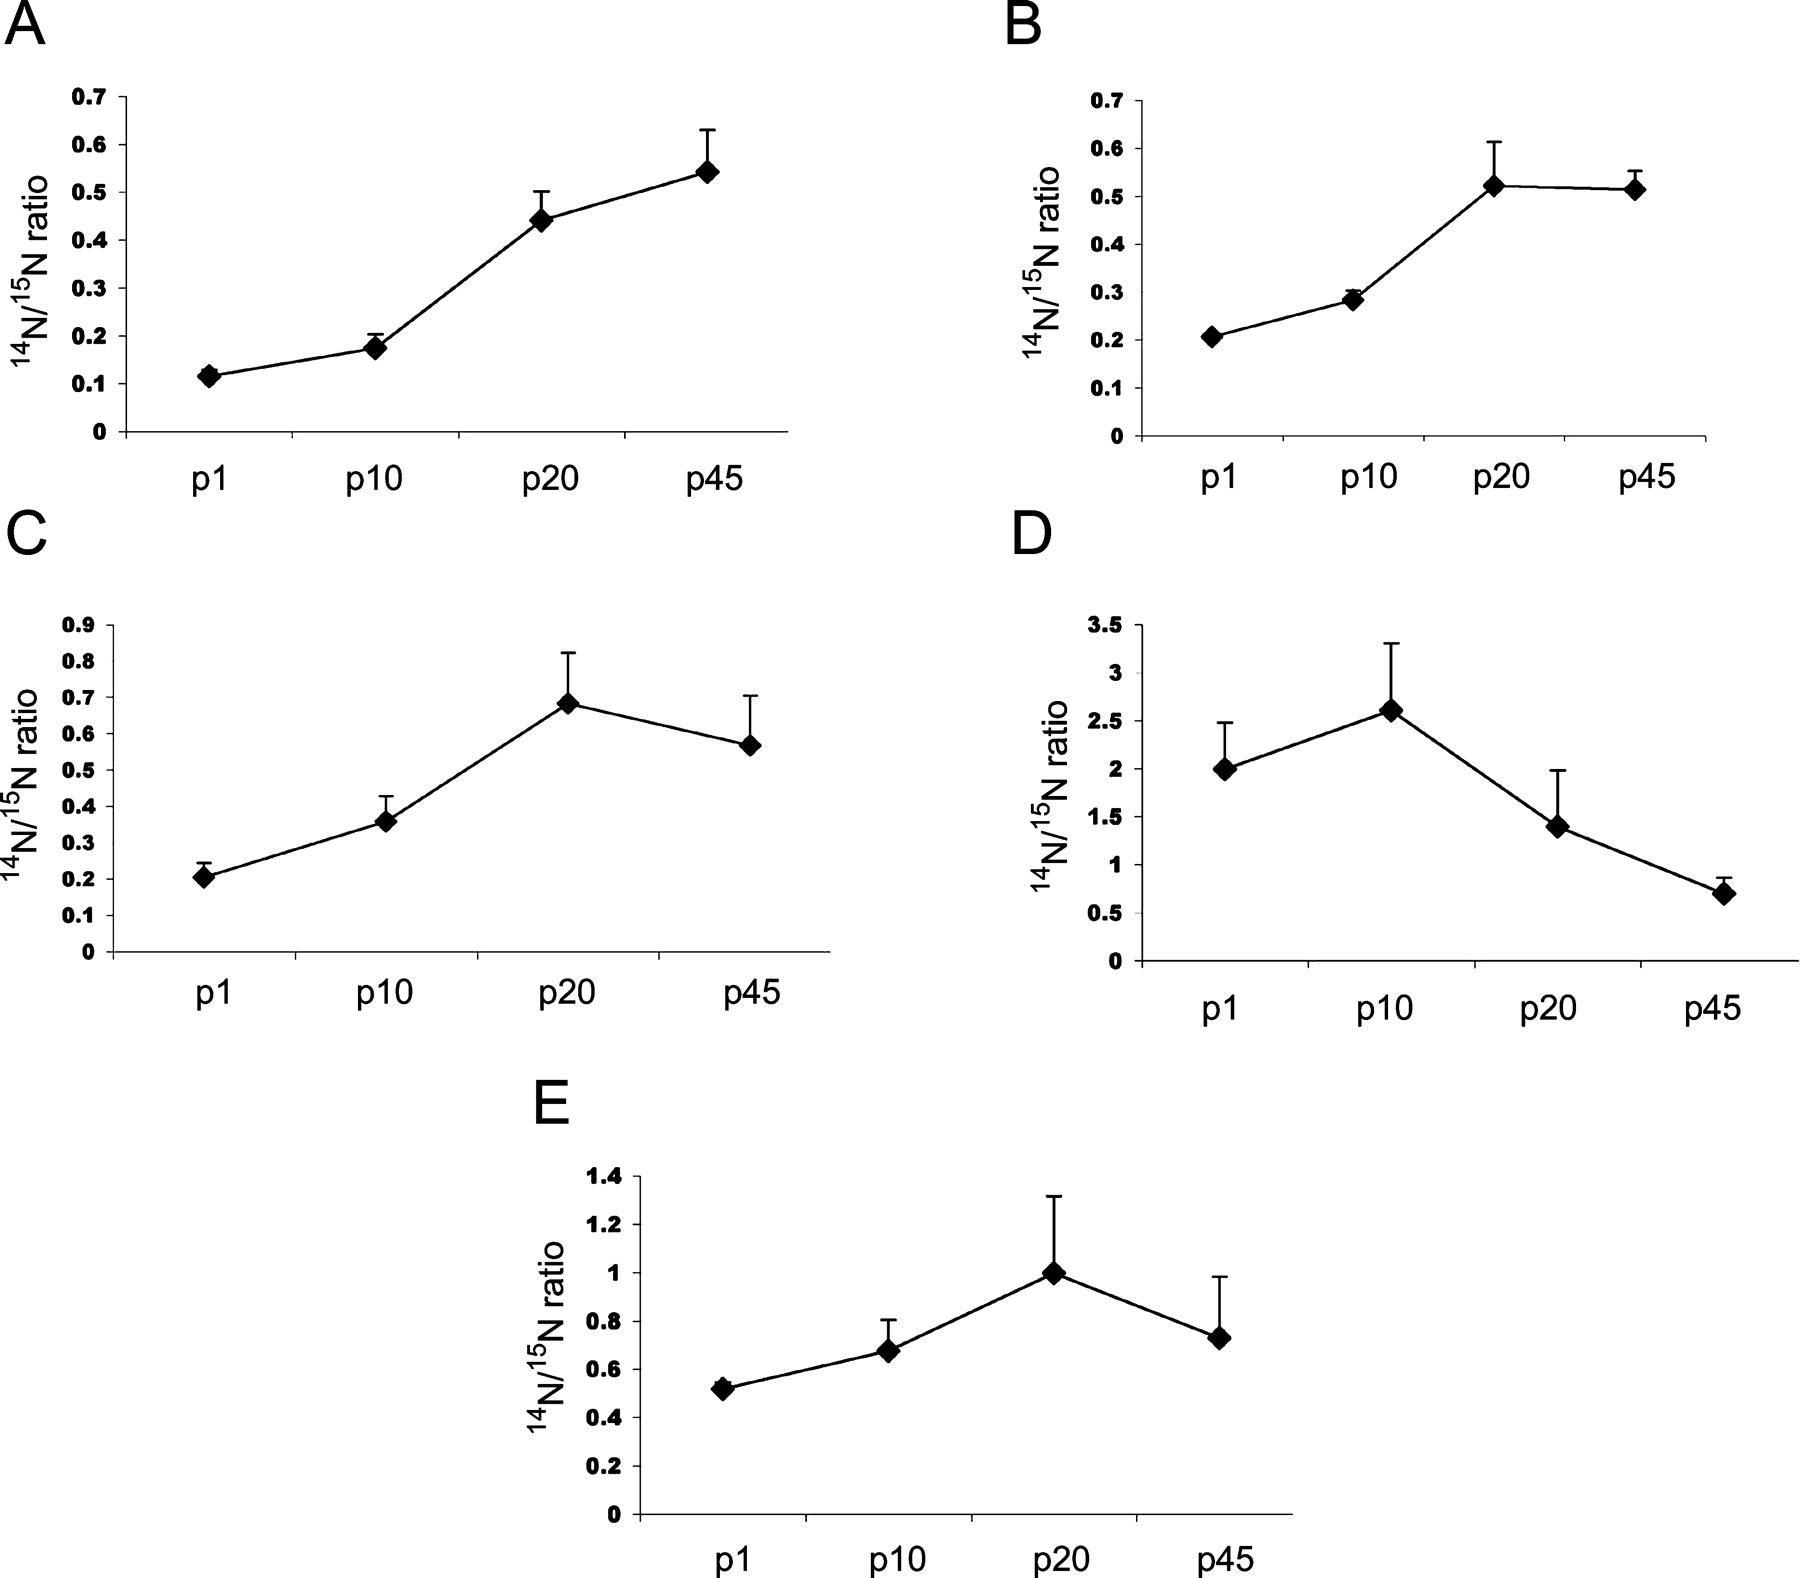
Figure 5.
Time course of protein expression during post-natal development. We identified significant linear trends of synaptic proteins during four developmental time points. (A) synaptophysin (P < 0.0001, P-value of linear trend post-hoc test), (B) GluR2 (P < 0.0001), (C) Na+/K+ ATPase alpha-1 (P < 0.0001), (D) eEF1A1 (P < 0.0001), and (E) eEF1A2 (P < 0.0007).


