
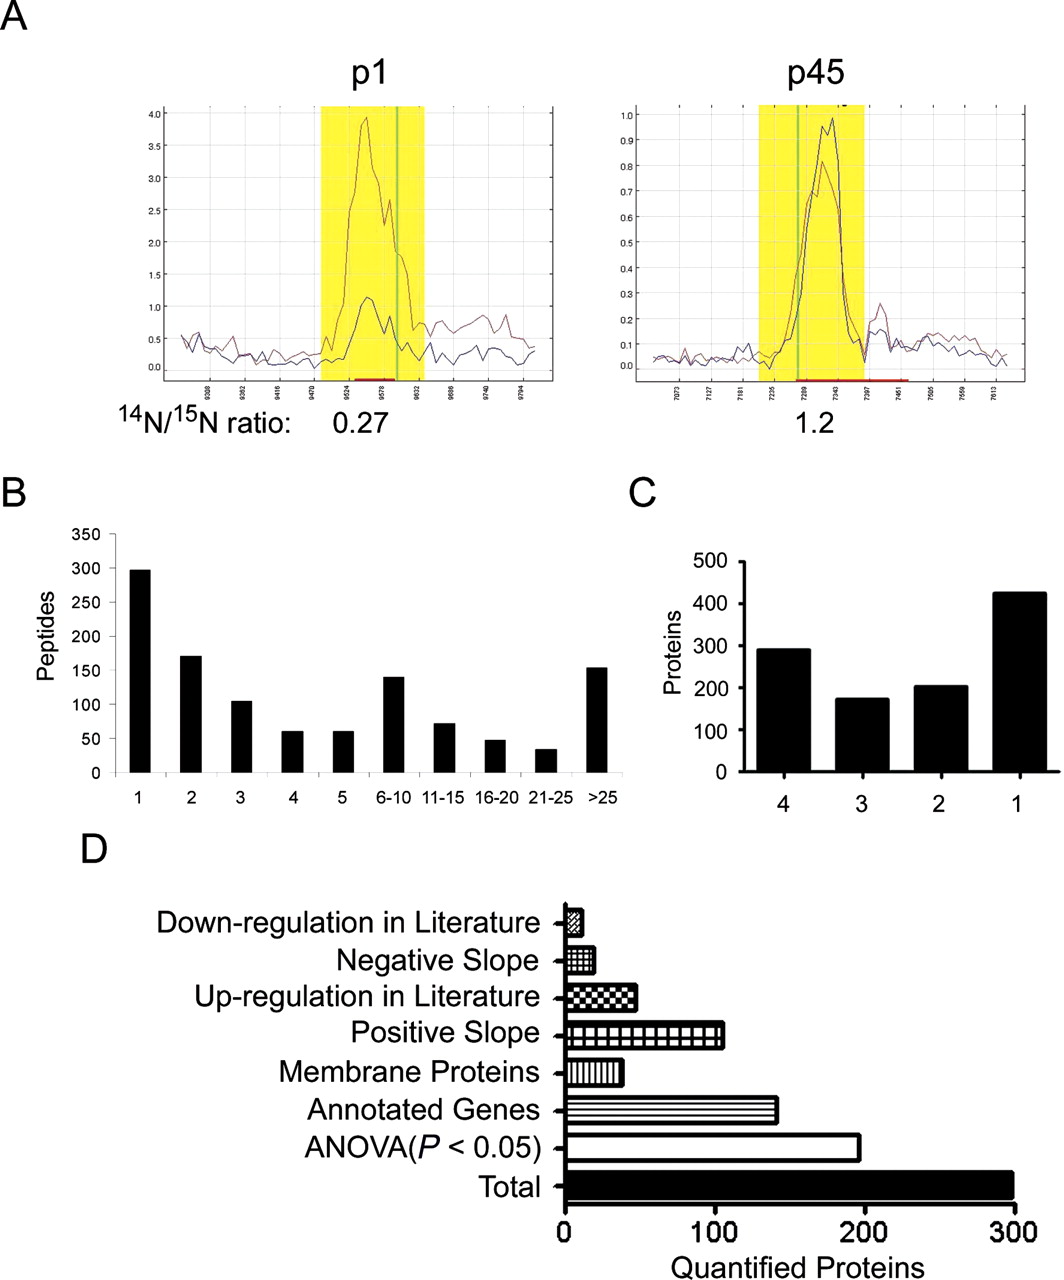
Quantitation of the synaptosomal proteome. (A) The Census graphical output for the peptide, MRAPPGAPEKQPAPGDAYGDA, from synaptophysin. The peptide elution peak is highlighted in yellow, and red line represents the 15N-labeled peptide, while the blue line represents 14N peptide. The Y-axis is relative intensity, and the X-axis is time. In the p1 sample, the 14N peptide is less intense than the 15N peptide, but the same peptide in the p45 sample is more intense than the 15N peptide. Census calculated the 14N/15N ratios as 0.27(p1) and 1.2(p45) consistent with the well-documented increase in synaptophysin during post-natal development. (B) Organizing the results as the number of quantified peptides per protein demonstrates 74% of the proteins were quantified with two or more peptides. In C, the X-axis represents the number of developmental periods in which a protein was quantified. (D) We performed ANOVA analysis on proteins that were quantified in at least three developmental periods, which was 298 proteins. One hundred ninety-six proteins were determined to have a statistical significant change in expression during development, and 141 of these proteins have annotated genes. We further analyzed these 141 proteins with an additional statistical test to determine if there is a statistically significant (P < 0.05) linear change of protein expression. We observed 105 proteins with positive slope and 19 proteins with a negative slope during development.


