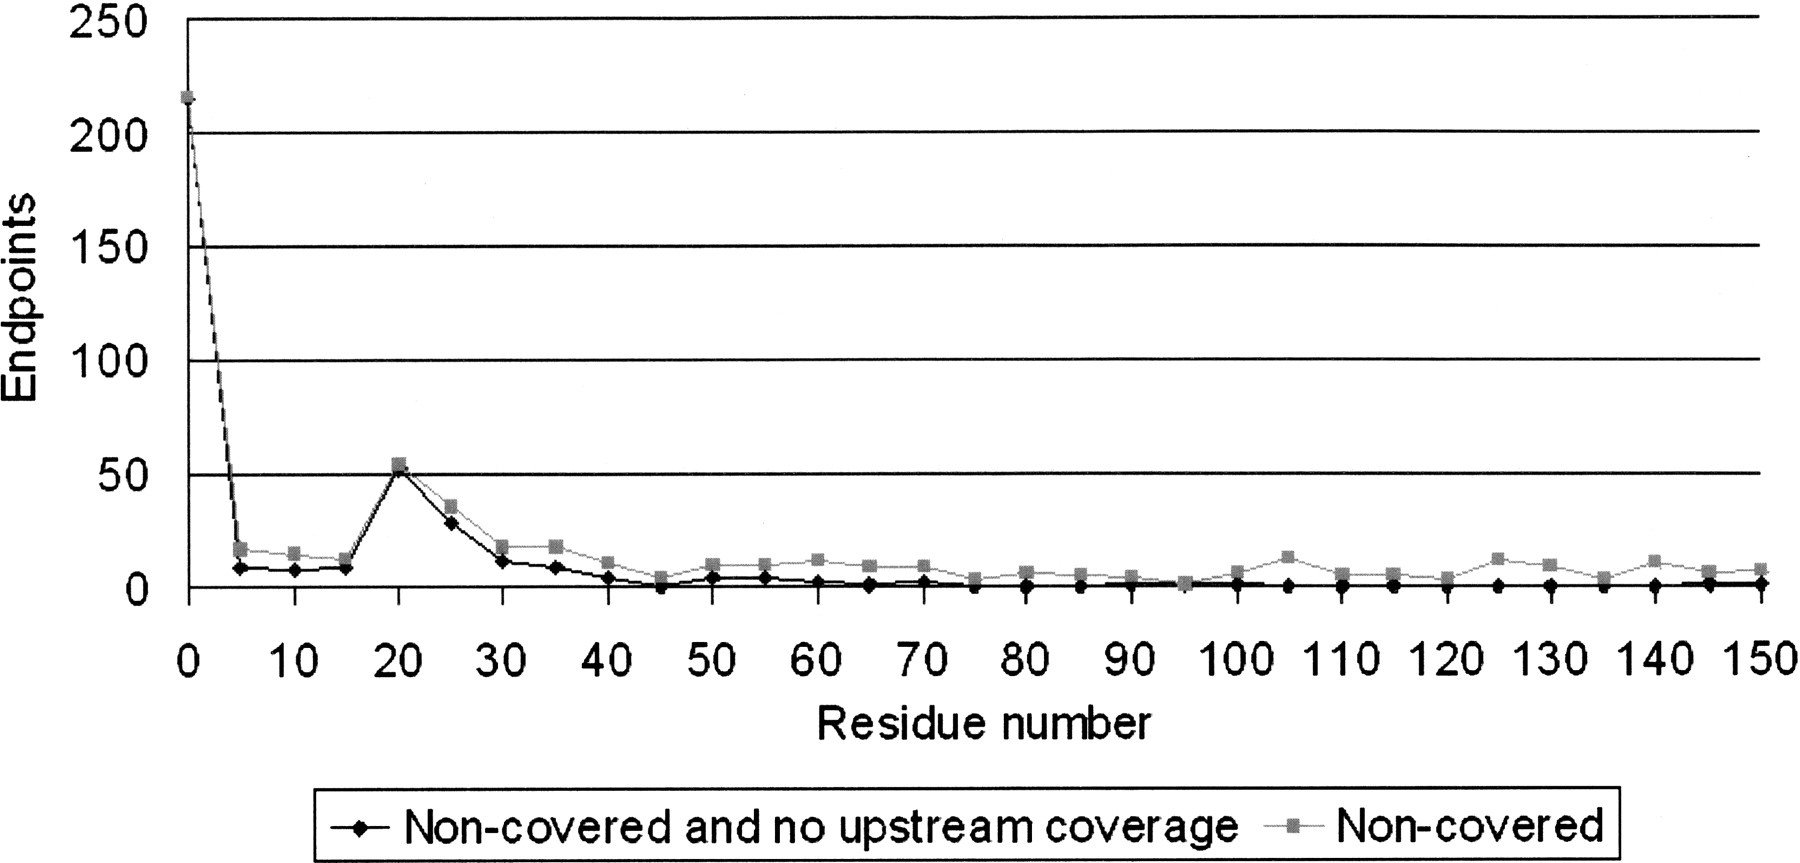
Whole proteome analysis of post-translational modifications: Applications of mass-spectrometry for proteogenomic annotation

(Downloading may take up to 30 seconds. If the slide opens in your browser, select File -> Save As to save it.)

Click on image to view larger version.

Figure 9.
Figure 9.

Distribution of the N termini of all noncovered peptides, and of those which also have no upstream coverage. Two peaks are observed at two and ∼20 amino acids. These correspond to N-terminal methionine cleavage and to cleavage of signal peptides.

This Article

  1. Genome Res. 17: 1362-1377

Preprint Server