
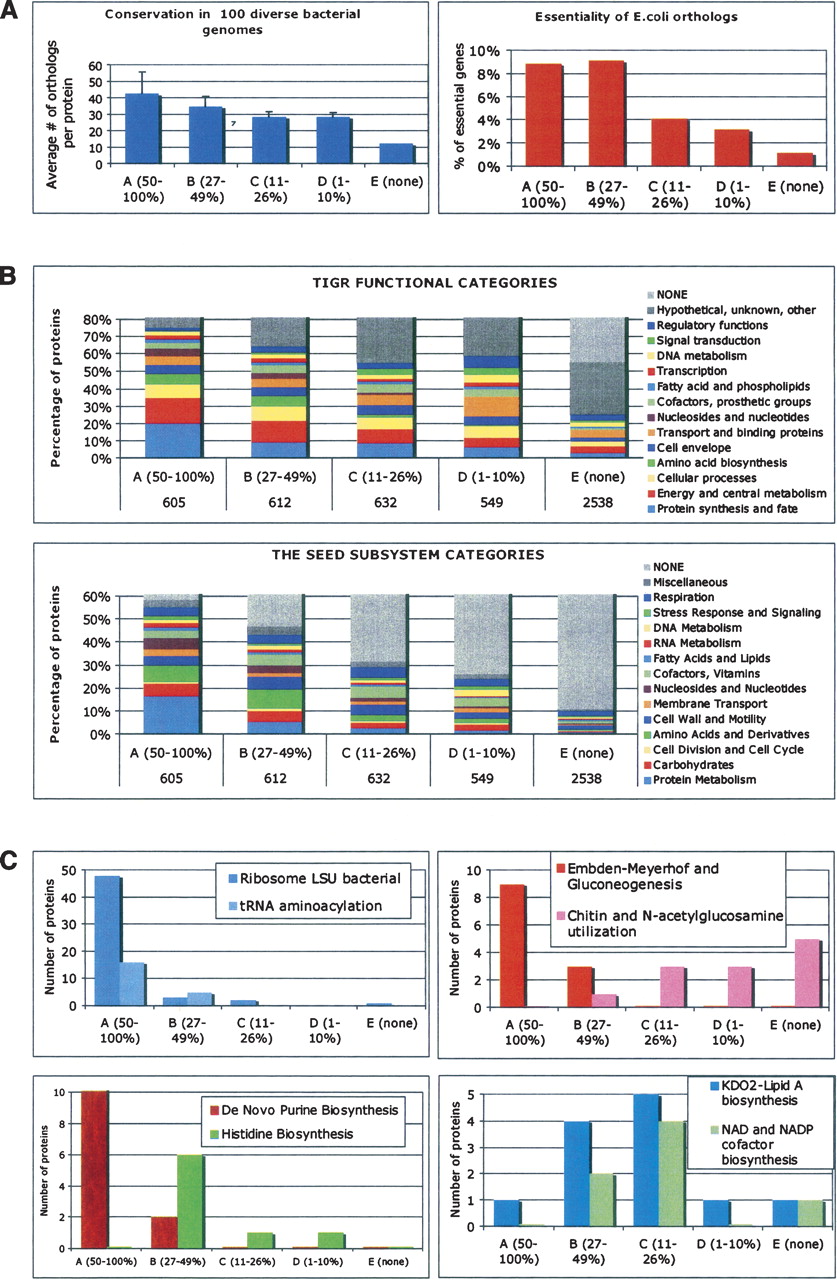
Correlations between coverage of individual proteins by MS-peptides and their biological features deduced from comparative genomics. (A) Conservation and essentiality. Conservation index for every protein was computed as a number of putative orthologs within a set of ∼100 diverse bacterial genomes (list provided in Supplemental Table S1B). A bar diagram on the left panel shows the corresponding values averaged for each coverage group. The right panel shows the fraction of E. coli orthologs (456, 419, 363, 322, and 738 in groups A–E, respectively) that were deemed essential in the published study (Baba et al. 2006) plotted for each coverage group. (B) Functional categories. The upper panel shows a distribution of proteins within each coverage group by main functional categories according to TIGR annotations (to avoid redundancy only one category was chosen for each protein). In the lower panel, a similar distribution reflects inclusion of proteins in a collection of categorized subsystems (pathways) in The SEED database (restricted to one subsystem per protein). (C) Examples of individual subsystems (pathways). A distribution of proteins between coverage groups is illustrated for eight subsystems selected from the six major functional categories (protein metabolism; carbohydrates; nucleosides and nucleotides; amino acids and derivatives; fatty acids and lipids; cofactors and vitamins).


