
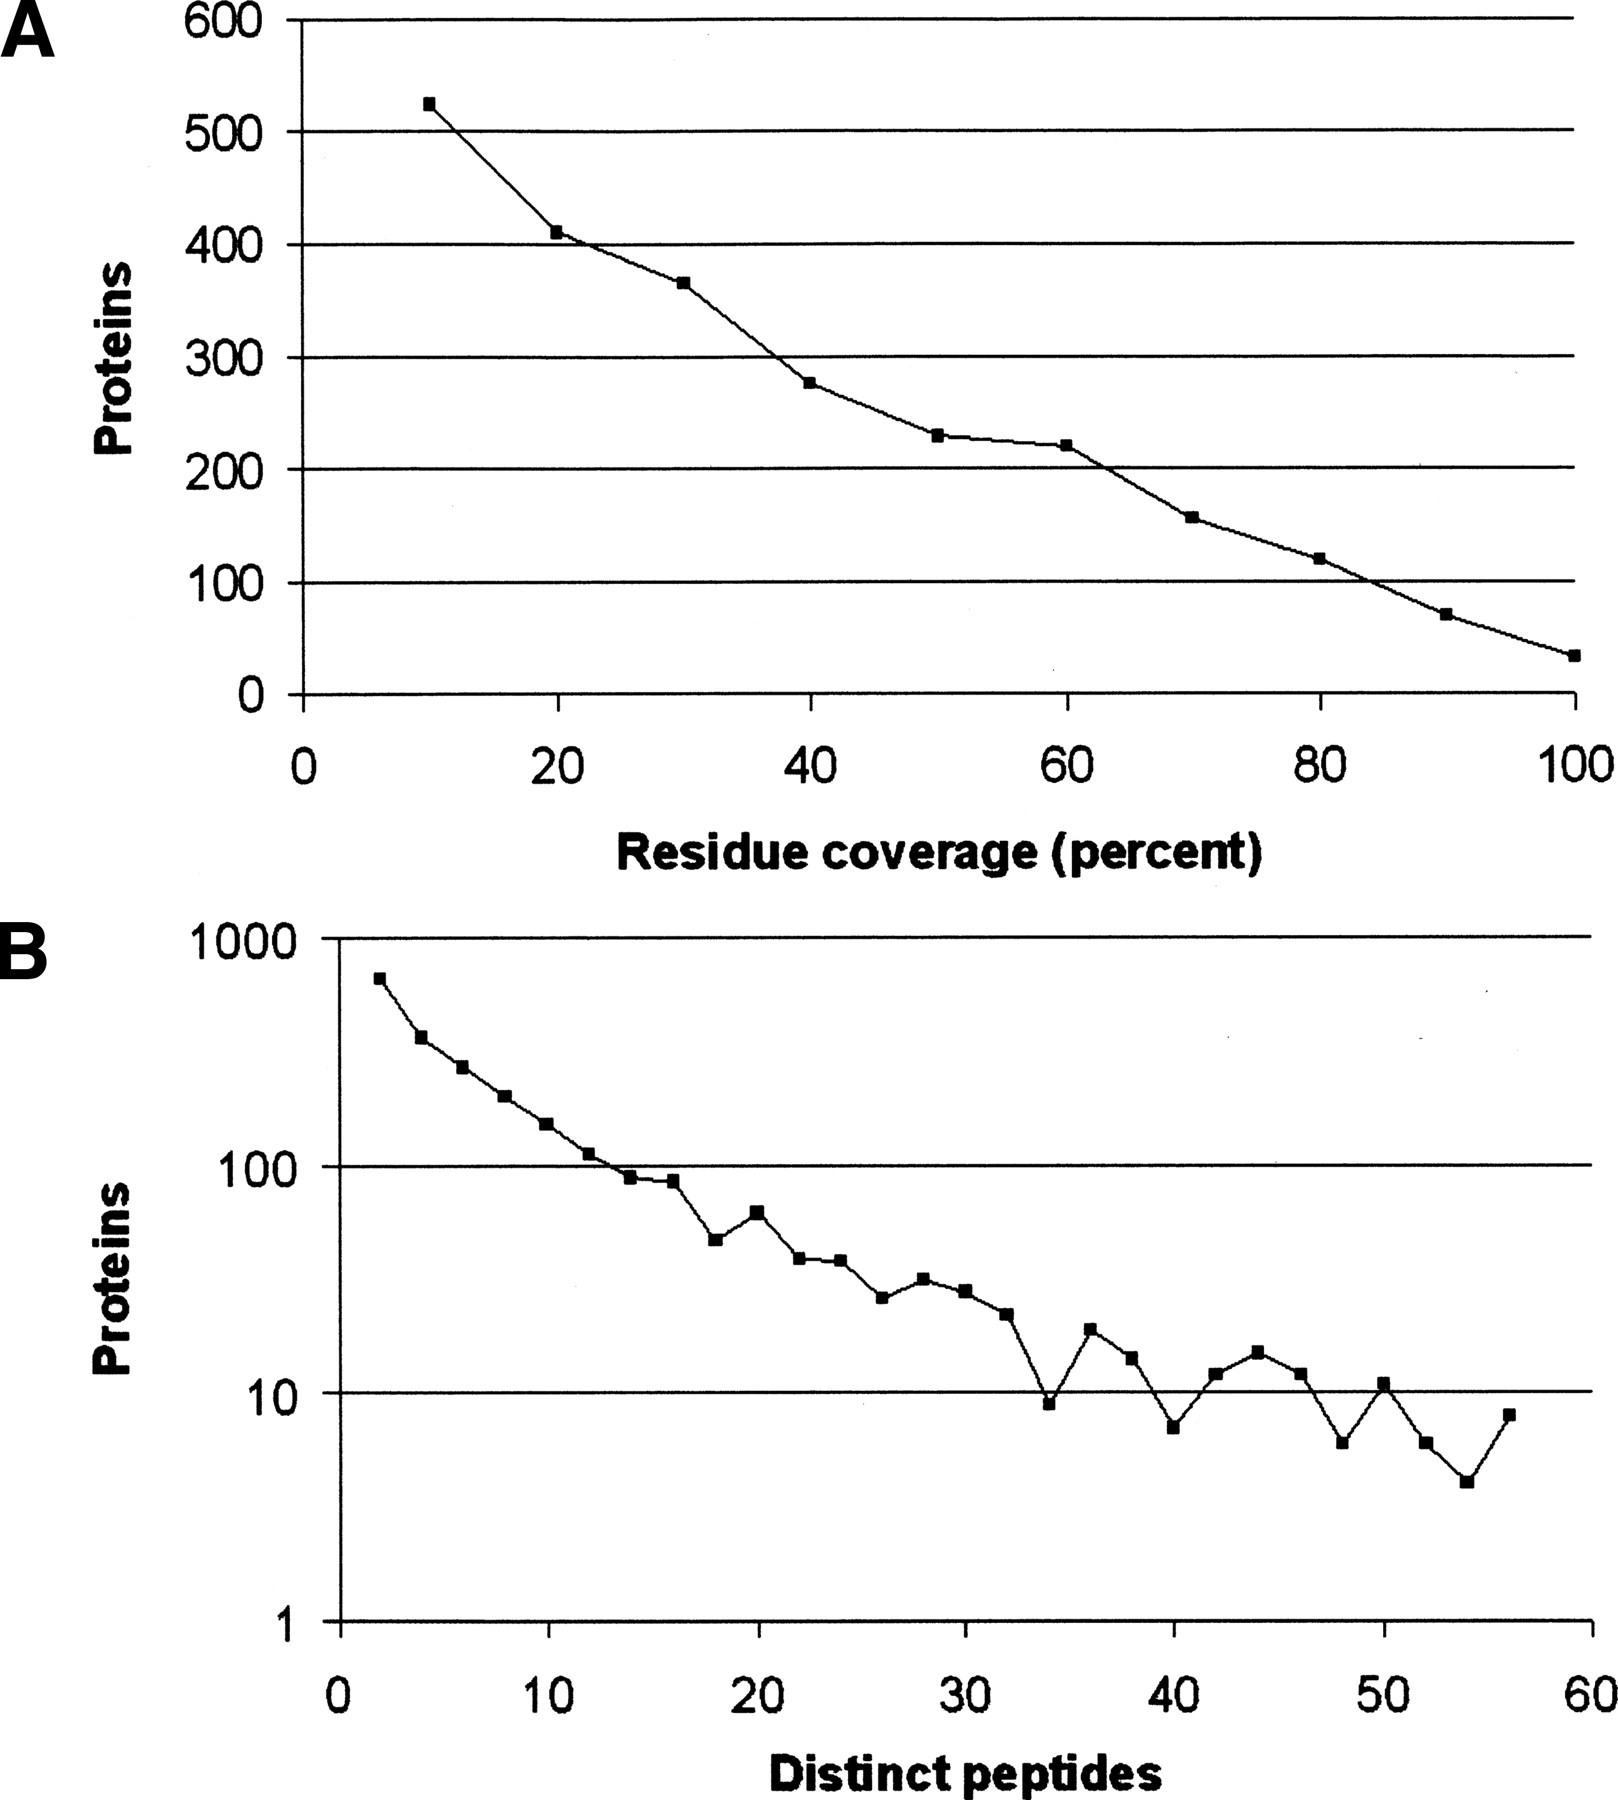
Figure 2.
(A) Distribution of the number of identified peptides observed for TIGR genes. Protein counts are plotted on a logarithmic scale. (B) Distribution of the residue coverage of TIGR genes by identified peptides. A total of 102 genes had coverage of ≥90%. Genes were grouped into percentage bins of size 10 percentage points based on their coverage.


