
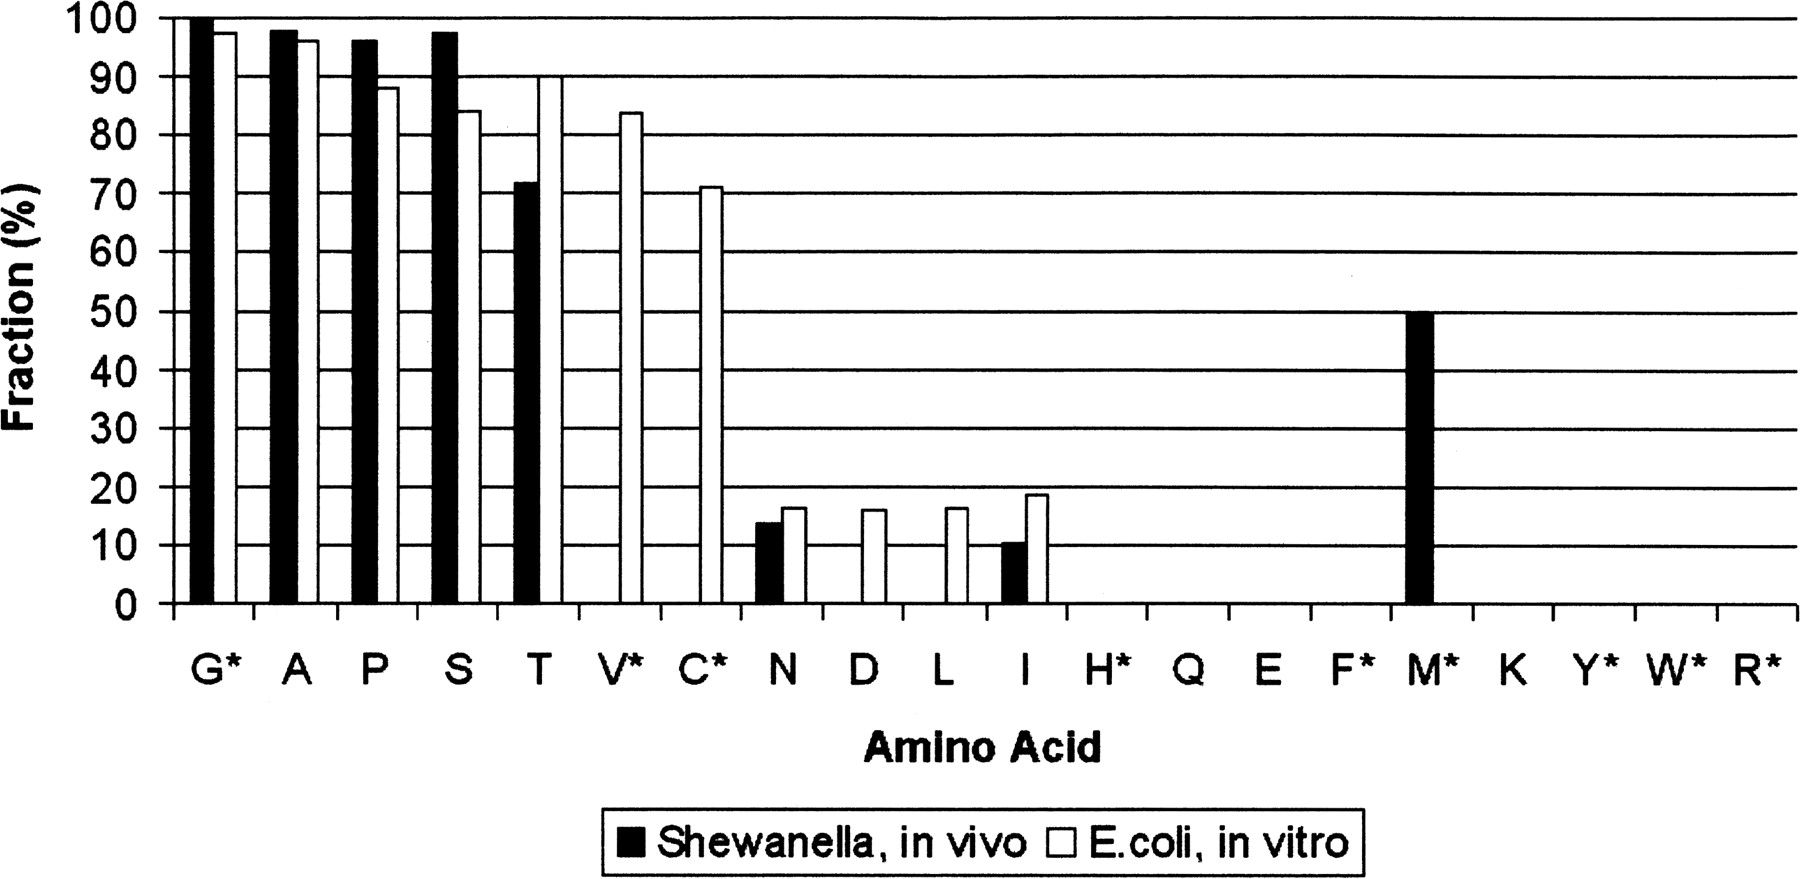
Fraction of peptides undergoing cleavage of N-terminal methionine, for a given second-position residue. Amino acids are arranged in increasing order by size of side chain. The in vitro data come from measurements of E. coli MAP enzyme efficiency (Hirel et al. 1989). The rates in vivo were estimated by counting the number of peptides. If X is the number of peptides that begin at residue 1 of a protein (indicating no cleavage) and Y is the number of peptides beginning at residue 2 (indicating a cleavage), the cleavage efficiency for that amino acid is defined as Y/(X + Y). Some amino acids are rarely used as the second residue of any of the TIGR genes (or GeneMark predictions). For instance, 308 protein sequences have serine at the second residue, while only nine have tryptophan. Because of this, our identifications contain relatively few N-terminal peptides for some amino acids. For the starred residues, 10 or fewer N-terminal peptides were observed with that residue at the second position.


