
Table 2.
Ka, Ks, and ω values for three NCLDV lineages
Click on table to view larger version.
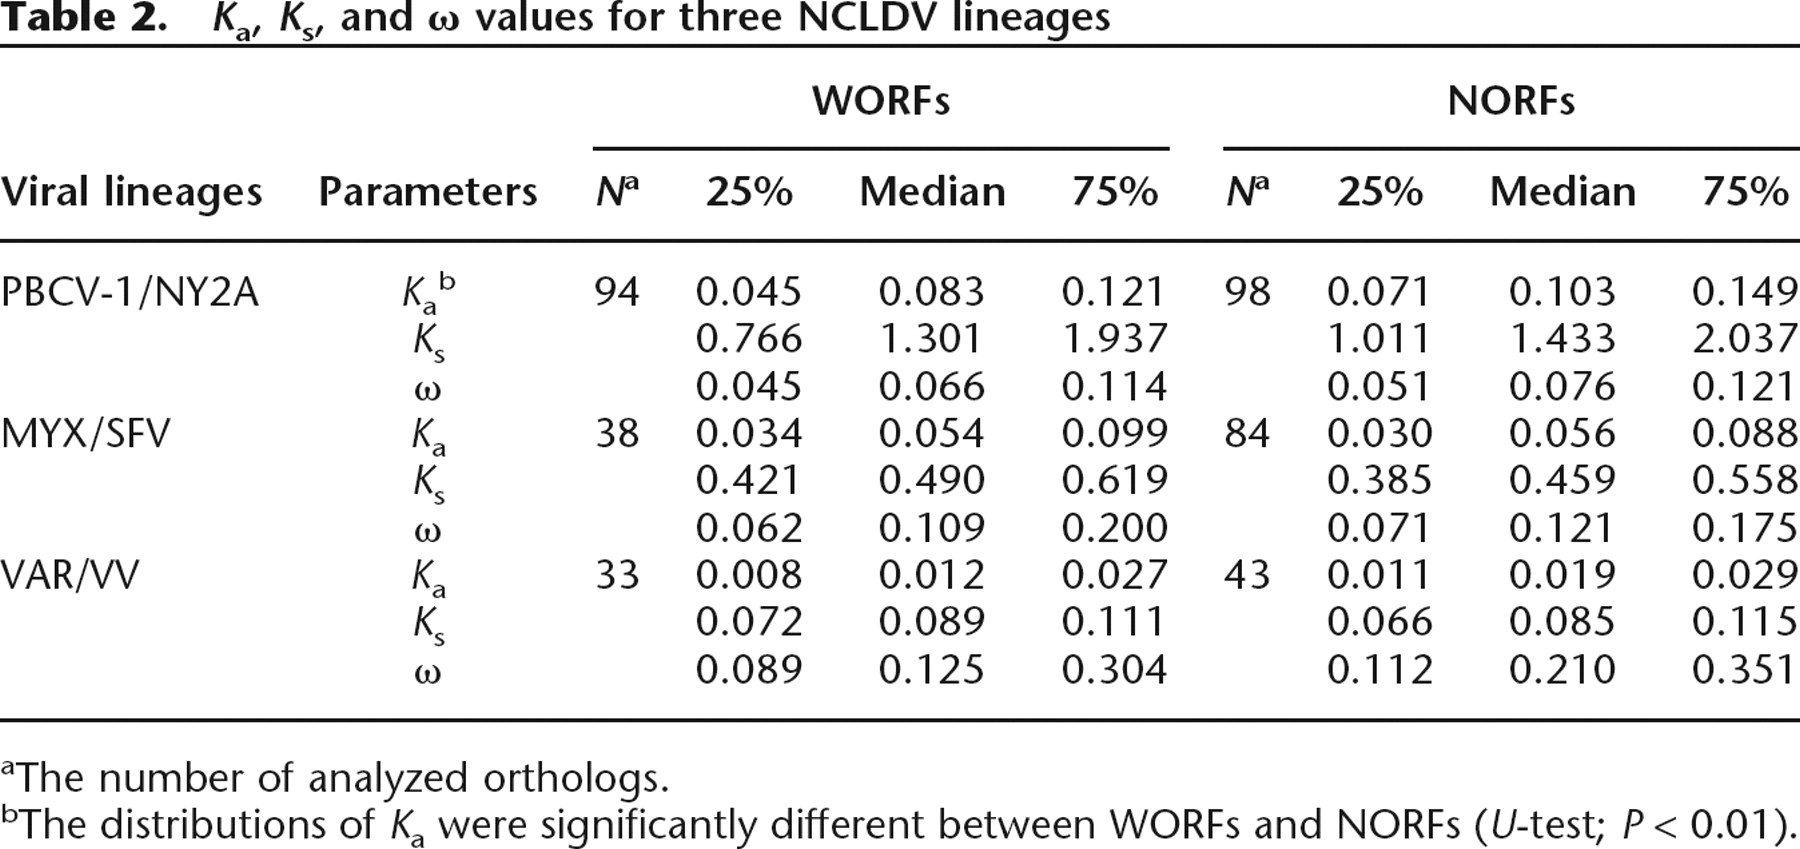
aThe number of analyzed orthologs.
bThe distributions of Ka were significantly different between WORFs and NORFs (U-test; P < 0.01).


