
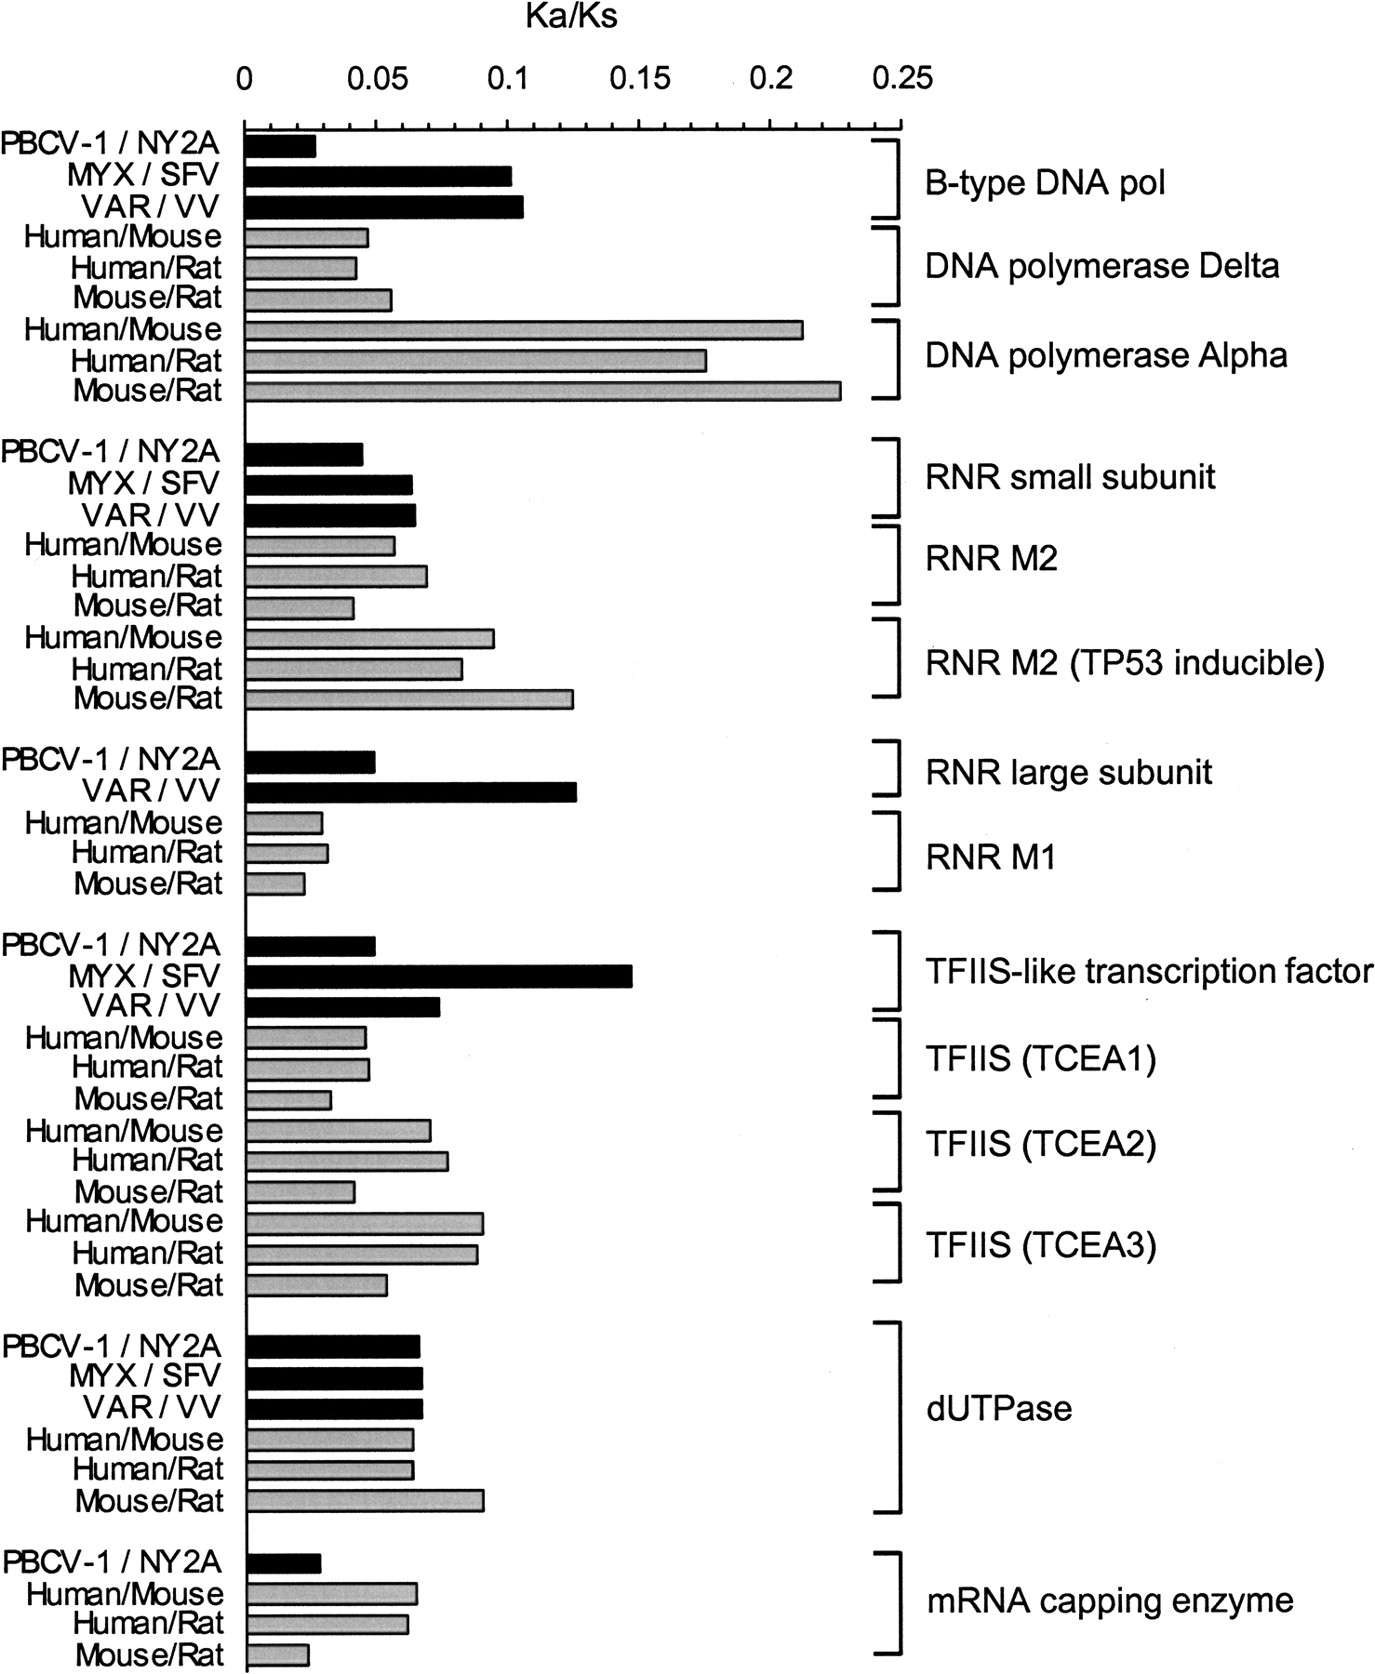
Figure 5.
Comparisons of Ka/Ks values between NCLDV genes and vertebrate homologs.
(Downloading may take up to 30 seconds. If the slide opens in your browser, select File -> Save As to save it.)
Click on image to view larger version.
Comparisons of Ka/Ks values between NCLDV genes and vertebrate homologs.
 CiteULike
 Delicious
 Digg
Digg Facebook
 Google+
 Reddit
 Twitter
