
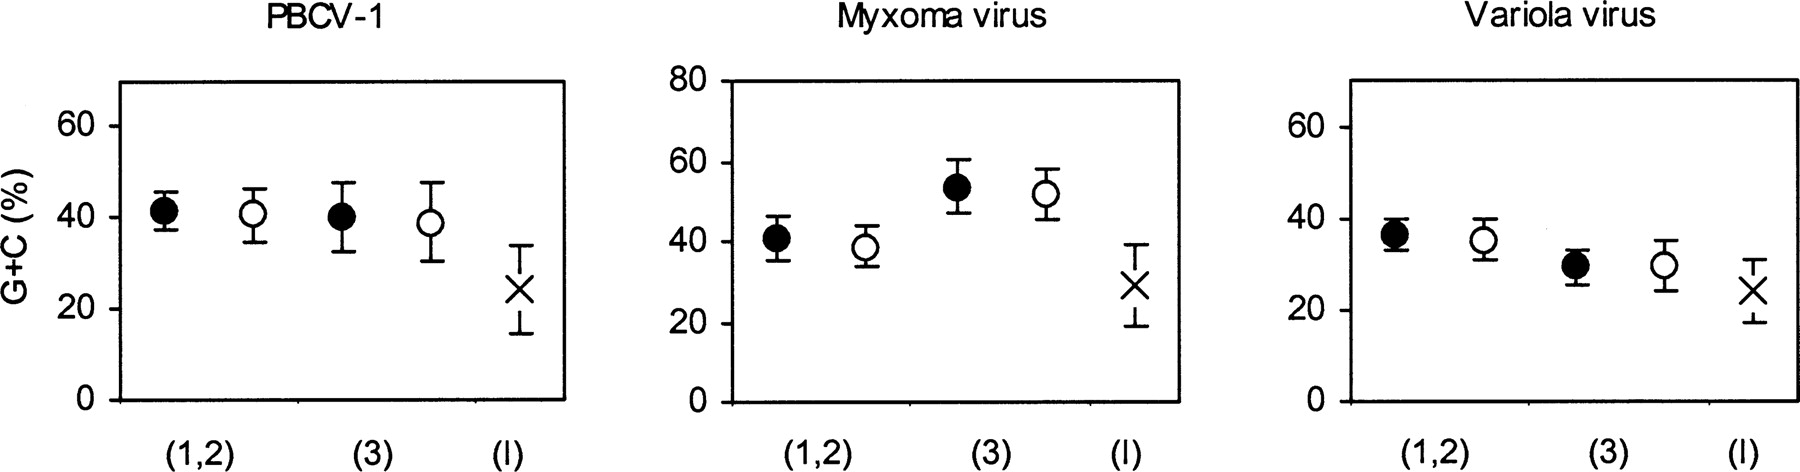
Figure 3.
Average G+C compositions of WORFs (filled circles), NORFs (open circles), and intergenic sequences (crosses). For WORFs and NORFs, the G+C compositions at the first and second positions (1,2) and the third positions (3) are separately computed. Bars correspond to a standard deviation. For intergenic sequences, those ≥20 nt were analyzed.


