
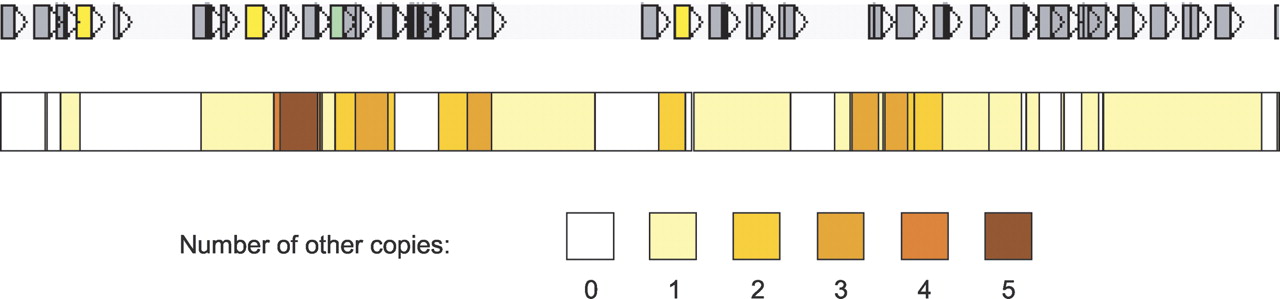
Figure 5.
Array evolution through duplication. For 31 VSG in the chr 8L array, which are depicted by boxes (followed by an orientation indicator) in the map at the top, the number of other copies of each in the genome (≥75% nucleotide identity) is shown by color intensity in the lower graphic, according to the tone key. The ends of duplicated sequences are aligned between the two graphics, demonstrating that these ends often coincide with the ends of VSGs.


