
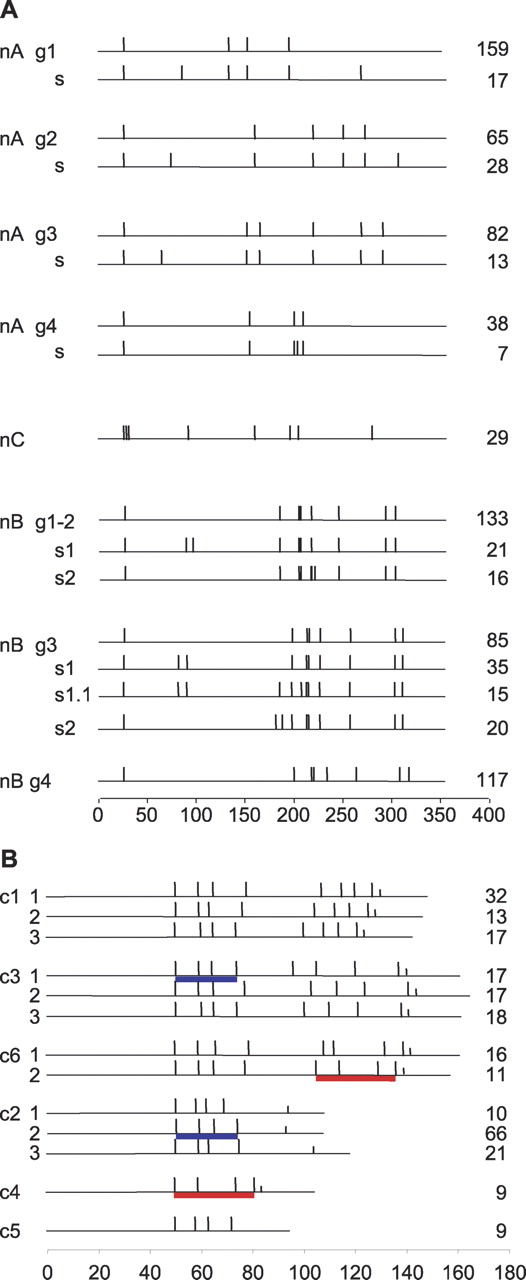
Figure 2.
Cysteine pattern of VSG domain types. Cys residue positions are shown as vertical bars, and the number of sequences in each category is shown to the right. Scale bars (number of residues) are shown for each panel. (A) N-terminal domain. g, group; s, subgroup. (B) Examples of C-terminal domain. Cys subdomains shared between different domain types are indicated by underlines of the same color. Two to three examples of domain type subgroups are given for the main domain types. Half-length vertical bars represent putative GPI signal sequences.


