
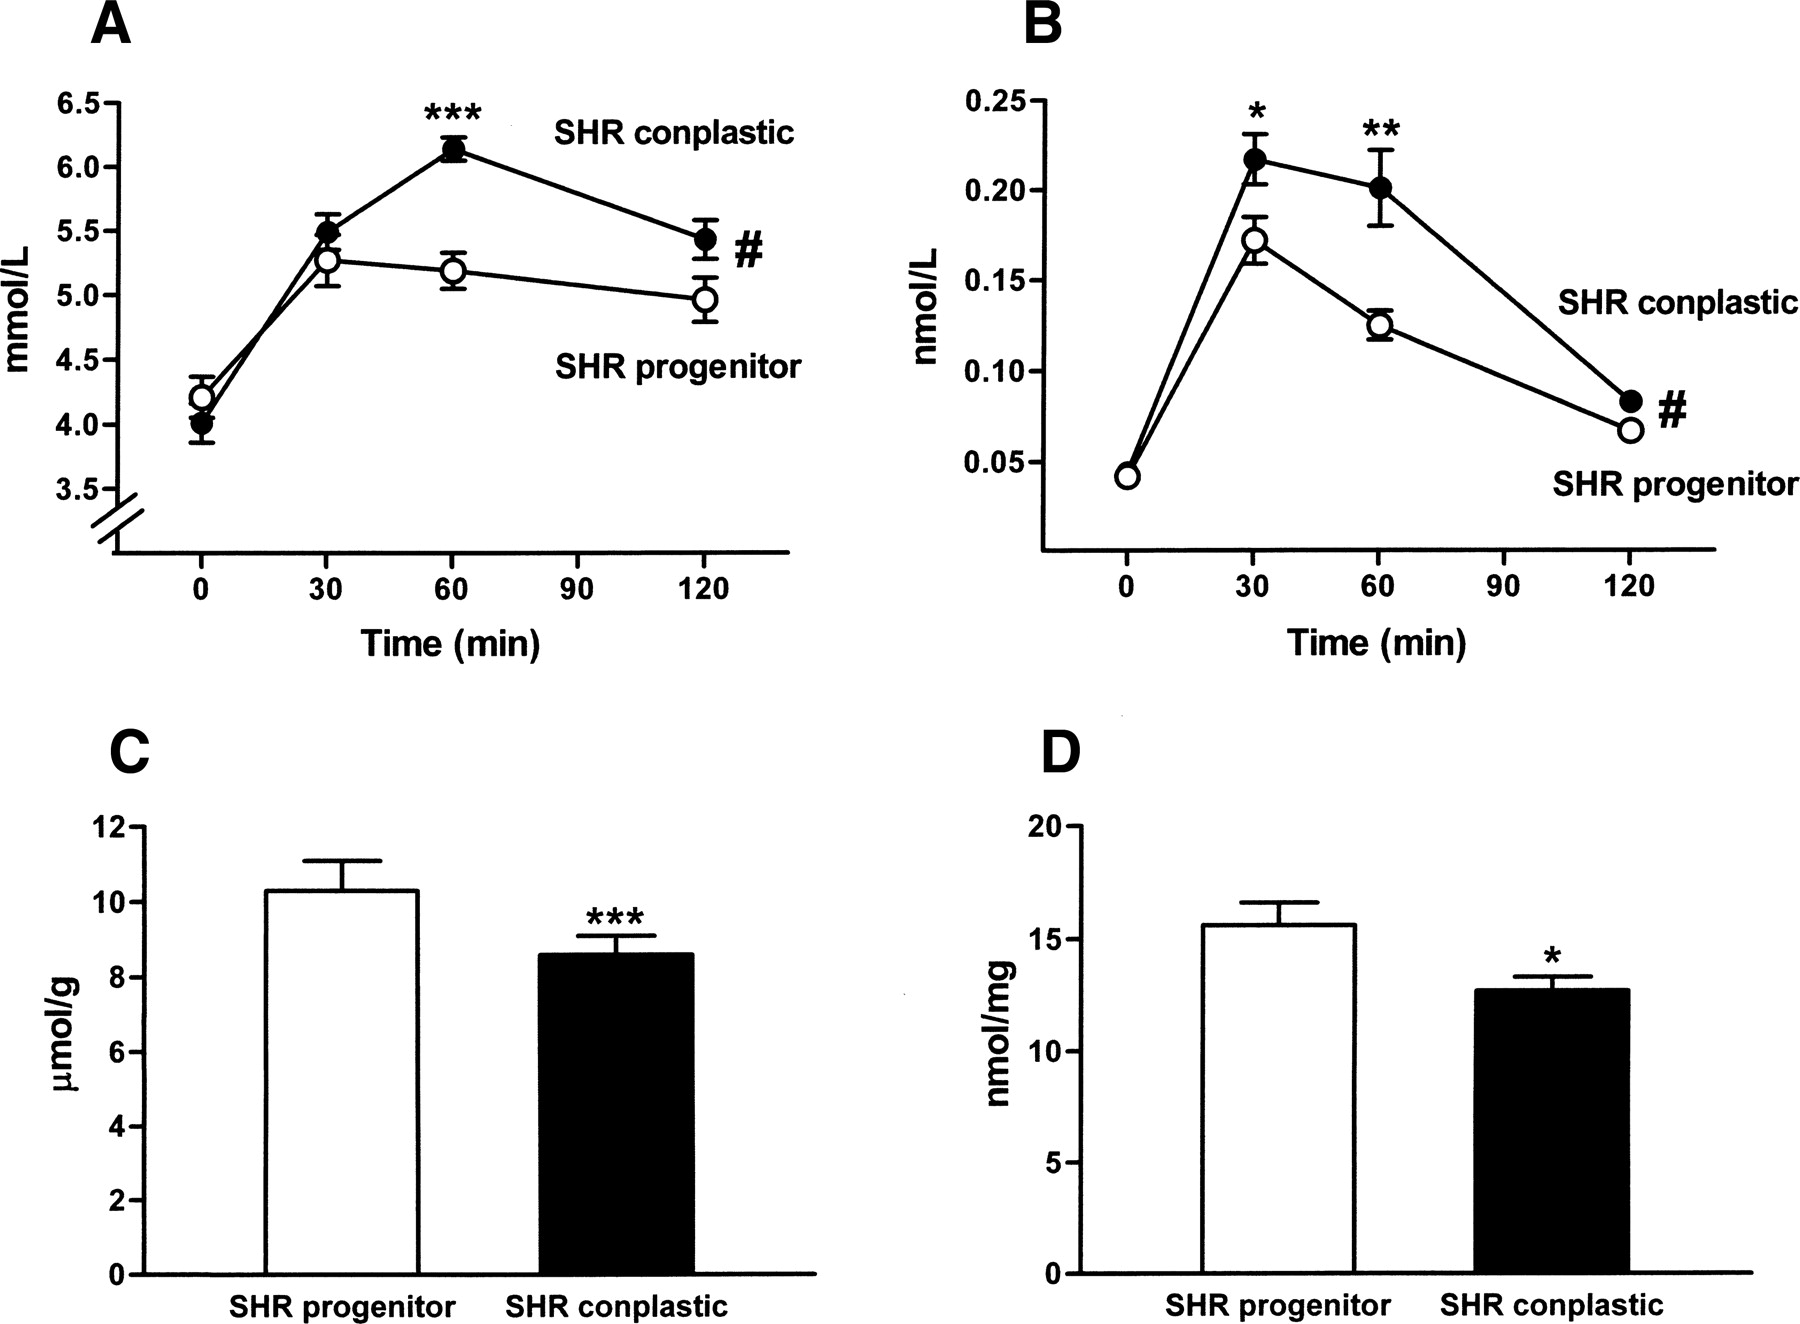
Metabolic differences between the SHR progenitor strain and SHR conplastic strain with identical nuclear genomes but different mitochondrial genomes. (A) Blood glucose levels before and after glucose administration in the SHR progenitor strain (open circles, n = 9) and the SHR conplastic strain (solid circles, n = 12). After oral glucose loading, the SHR conplastic strain showed a significantly greater area under the curve for blood glucose than the SHR progenitor strain, 664 ± 9 mmol/L/2 h versus 603 ± 11 mmol/L/2 h, respectively (P < 0.01). Significant differences at individual time points are marked by asterisks. (B) Serum insulin levels before and after oral glucose administration. Same symbols as for serum glucose results. After oral glucose loading, the SHR conplastic strain showed significantly greater area under the curve for serum insulin levels than the SHR progenitor strain, 18.8 ± 1.3 nmol/L/2 h versus 13.6 ± 0.6 nmol/L/2 h, respectively (P < 0.01). (C) Glycogen content in skeletal muscle. Glycogen content in skeletal muscle tissue from the SHR conplastic strain (solid bar, n = 12) was significantly lower than in the SHR progenitor strain (open bar, n = 9, P < 0.001). (D) ATP content in skeletal muscle. ATP content in skeletal muscle tissue from the SHR conplastic strain (solid bar, n = 6) was lower than in the SHR progenitor strain (open bar, n = 5, P < 0.05). (***) P < 0.001; (**) P < 0.01; (*) P < 0.05 in individual time-point comparisons between the SHR progenitor and conplastic strains; (#) P < 0.01 for area under the curve comparisons.


