
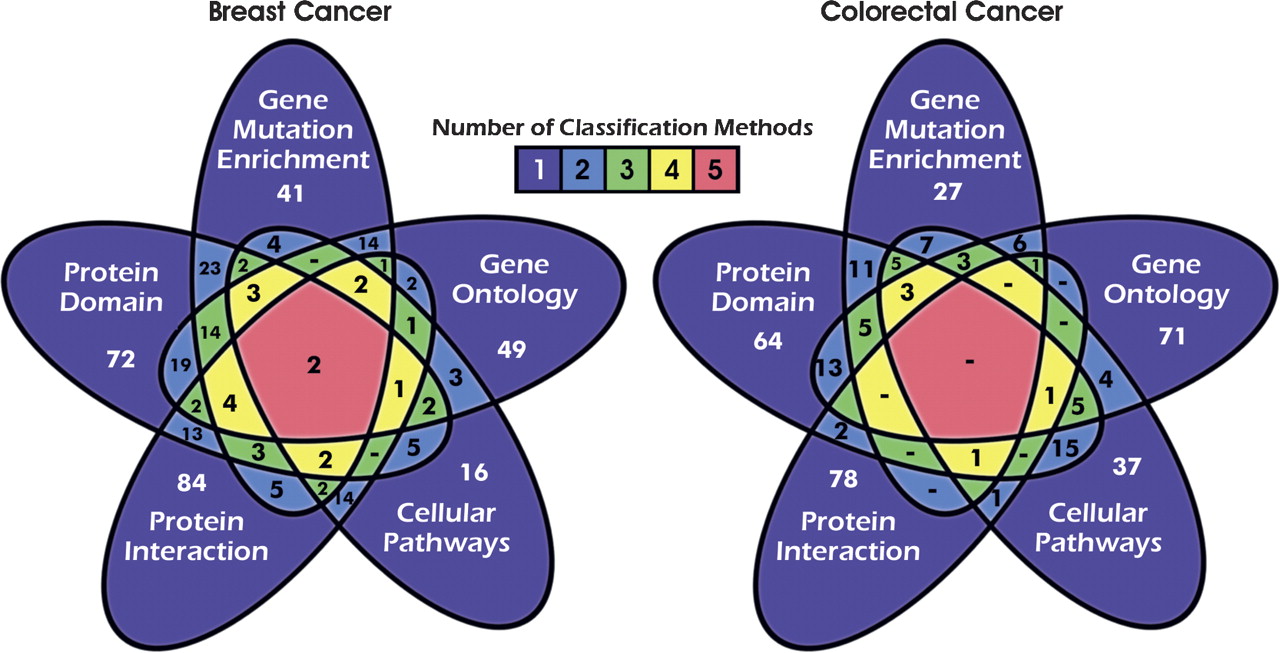
Figure 5.
Comparison of genes annotated though different mutation enrichment classification methods. Five-way Venn diagrams (Grünbaum 1975) show the number of genes annotated through the indicated methods for breast and colorectal cancers. The “Gene Mutation Enrichment” set are the CAN-genes defined by Sjöblom et al. (2006). Each region indicates the number of genes that are detected by the different analytical methods, and is colored according to the number of methods that identify those genes. The genes detected by each classification method are listed in Supplemental Table 4, A and B.


