
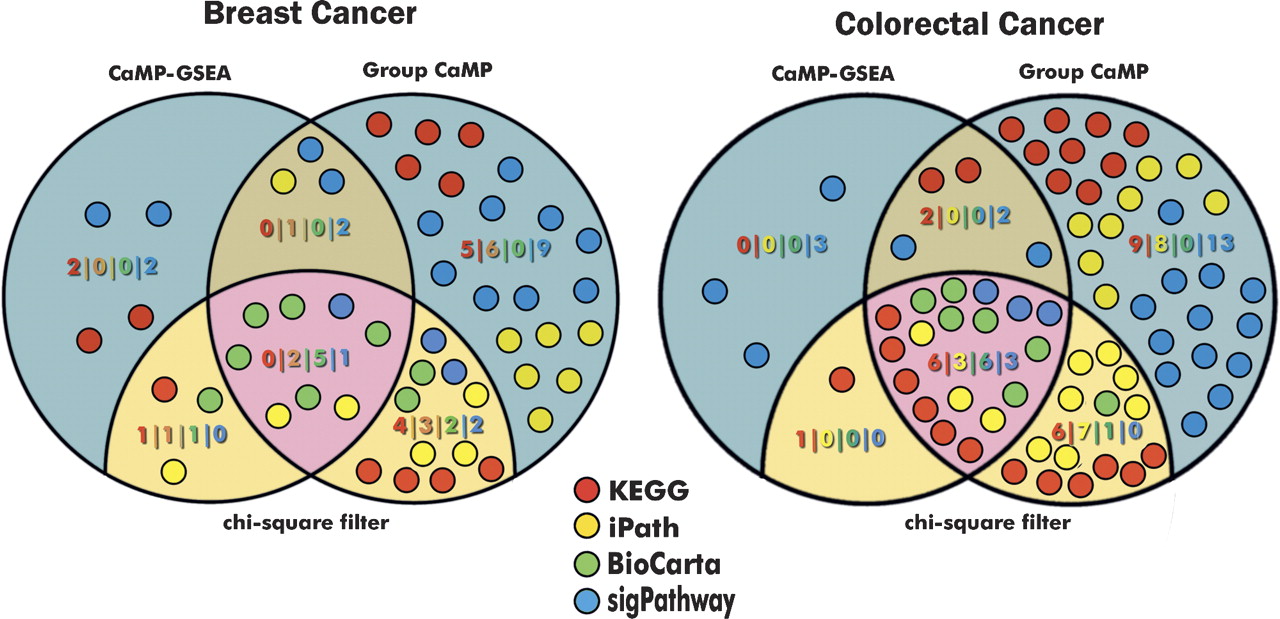
Figure 4.
Comparison of mutation enrichment in cellular pathways using complementary statistical approaches. Venn diagrams show the number of pathways identified from four different databases in breast (left) and colorectal cancers (right) using CaMP GSEA and Group CaMP approaches. Each circle represents one pathway and is colored according to the database it belongs to. Pathways that were enriched for mutations and which were filtered for an increase in the number of genes using the χ2 test are shown in tan or pink. Blue and dark tan areas represent pathways that were excluded using the χ2 filter (for additional details, see Methods).


