
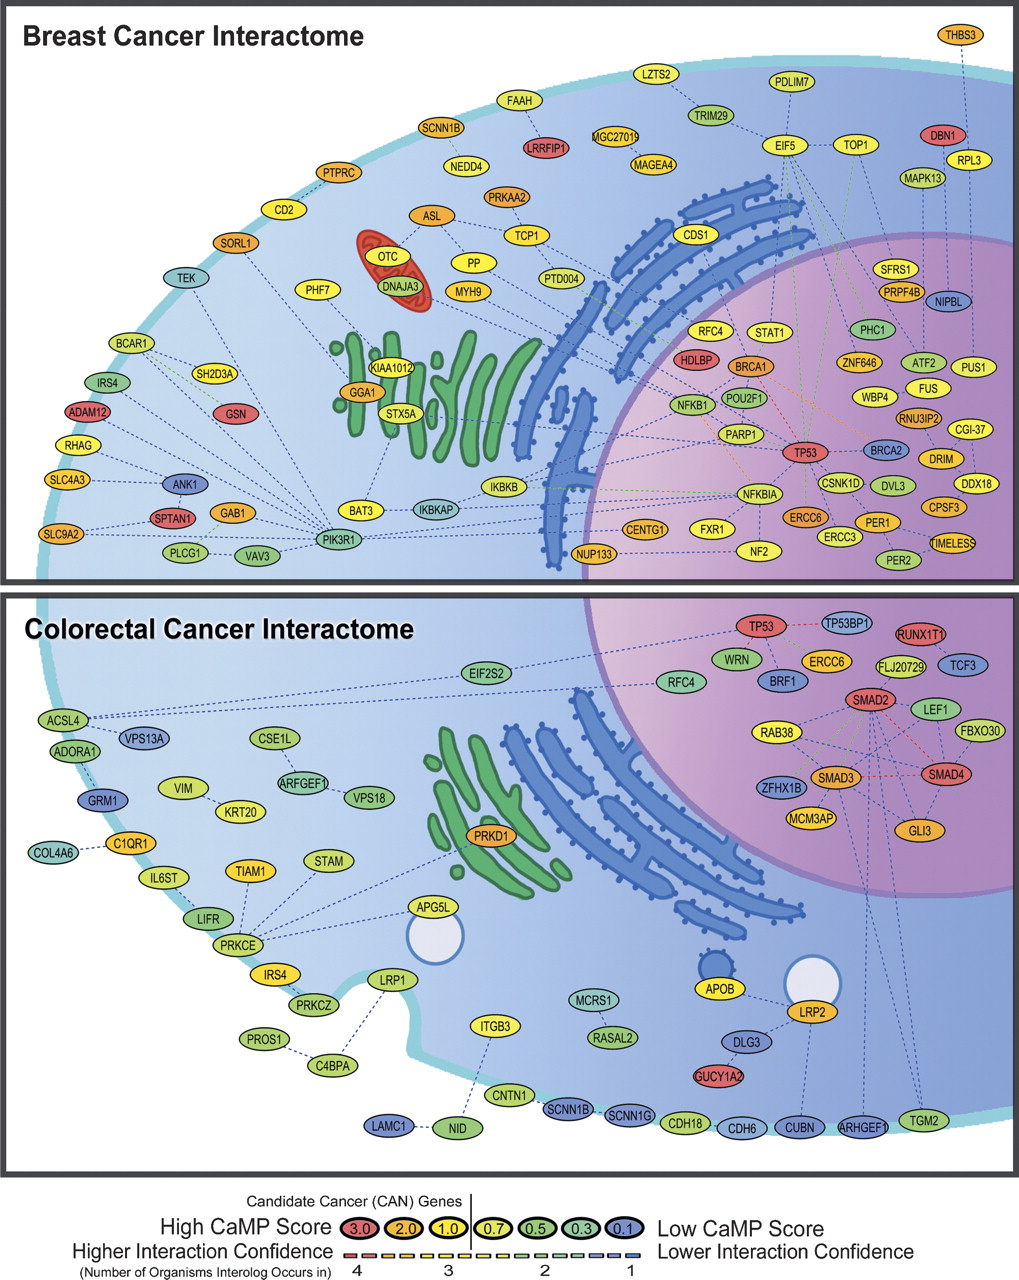
Figure 3.
Interaction among proteins mutated in breast and colorectal cancers. Each node represents a mutated protein that is colored according to Cancer Mutation Prevalence (CaMP) Score, and each line represents an interaction confidence. CAN-genes identified by Sjöblom et al. (2006) have a CaMP score >1 and are colored in orange and red. The genes are placed within cellular compartments as annotated in Gene Ontology.


