
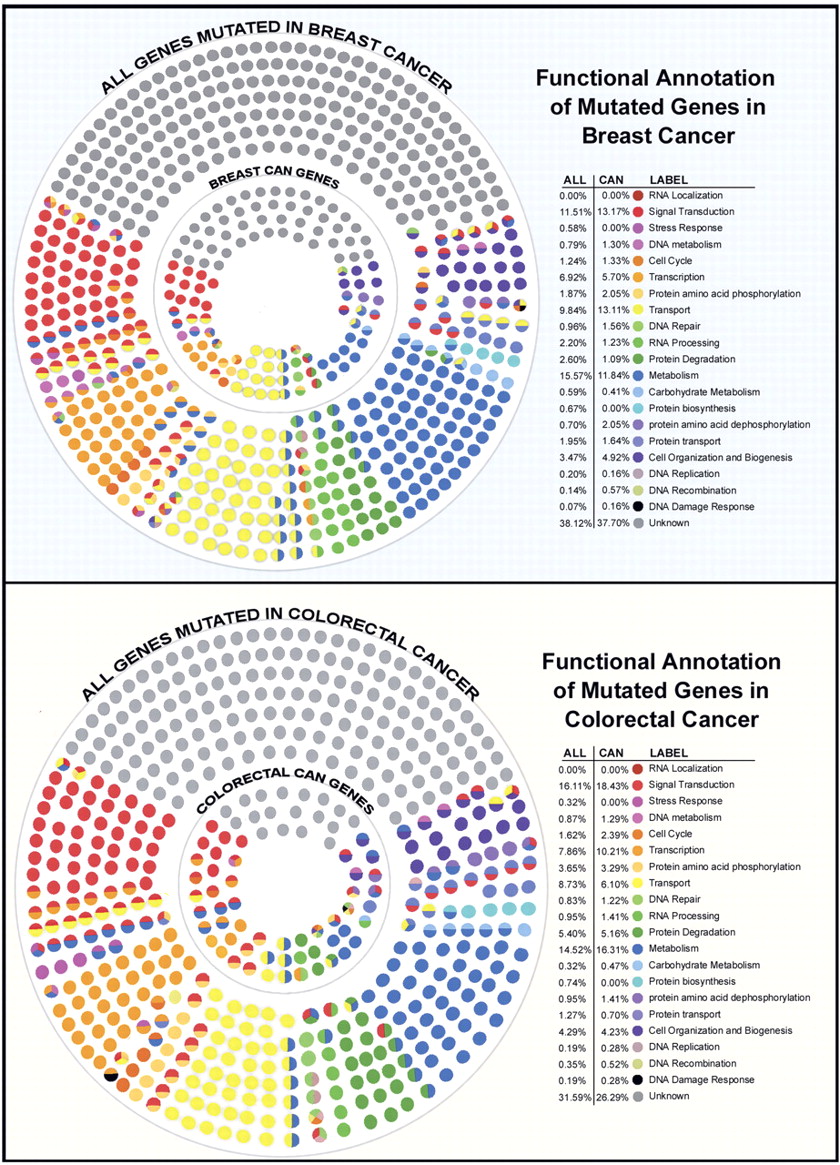
Figure 2.
General functional categorization of genes mutated in breast and colorectal cancers. Each small circle represents a mutated gene in breast or colorectal cancer and is colored according to the general functional categories shown in the legend (for details, see Methods). The entire set of circles represents all the genes mutated in each cancer type, while the interior subset is comprised of the genes with the highest CaMP Scores (the CAN-genes). The percentage of genes that belong to each functional category is shown in the legend.


