
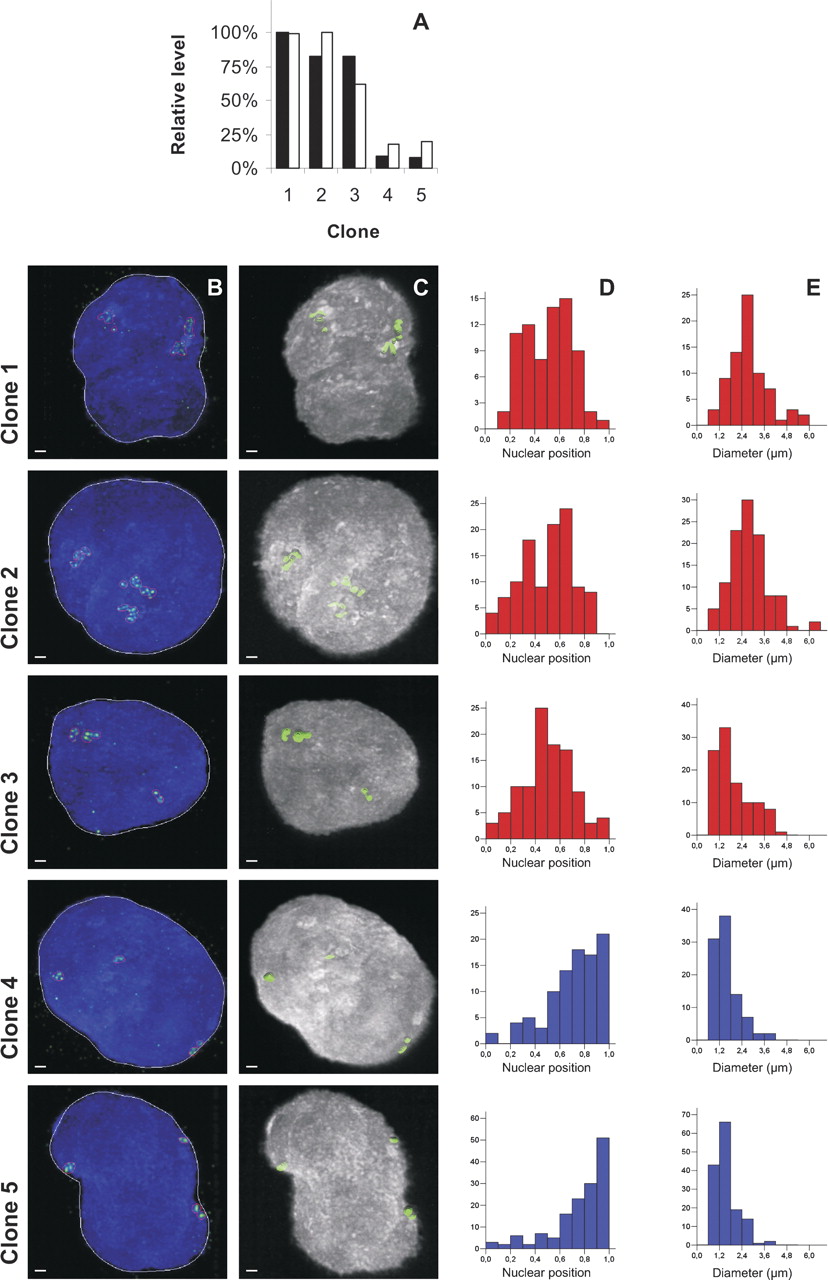
Three-dimensional FISH analysis of domains in five clones harboring GFP integrations on Chromosome 1. (A) Relative levels of GFP expression (black bars) and domain activity of the integration sites (shaded bars) in five clones. Highest values are set at 100% and domain activity is defined as the median expression of the surrounding 49 genes (133 pooled SAGE libraries). (B,C) FISH analysis of 2.2-Mb regions surrounding the integrated GFP construct of five clones (rows) illustrates the 3D structure of each domain. Representative 3D FISH images of each domain are shown as projection (B) and after volume rendering (C). Per clone, 30–60 nuclei were analyzed. (Green) The transgene integration domain; (blue) nuclei were counterstained in DAPI. Scale bars, 1 μm. Red lines in B represent contours of the hybridized areas. (D) Histograms showing the distribution of integration domains (count per signal, Y-axis) of each of the clones [(red) ridge clones; (blue) anti-ridge clones] with respect to their squared nuclear positions (D) or their diameter (E). In D the X-axis shows the relative position of the domain, ranging from 0 (center) to 1 (nuclear periphery). In E the X-axis depicts the largest diameter in 3D of a domain. The histograms and images show that the ridge domains (clones 1–3) localize more to the interior and are less condensed than the anti-ridge domains (clones 4 and 5).


