
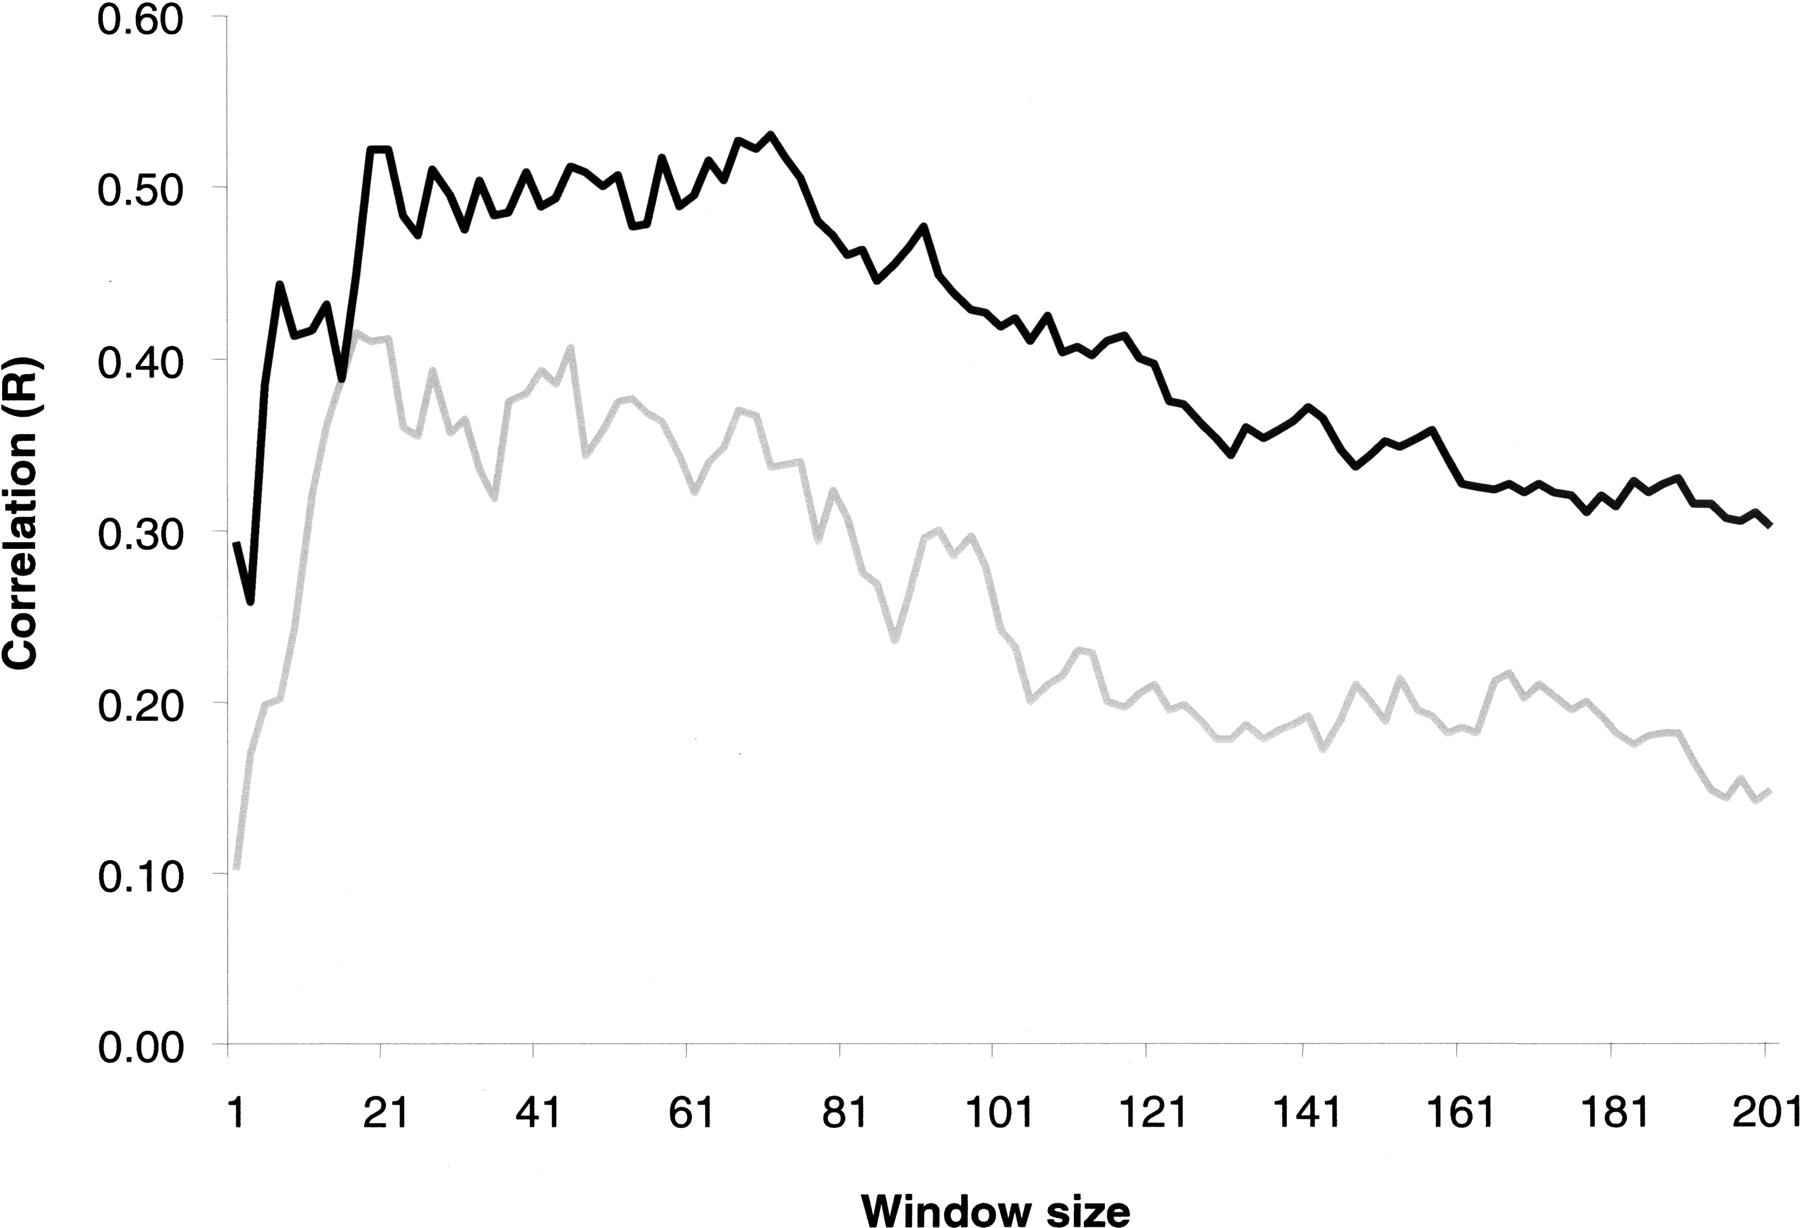
Figure 3.
Correlation between GFP expression and domain activity for window sizes of 1–201 genes. The Pearson correlation coefficient (R, Y-axis) was calculated for GFP expression and domain activities of the integration sites of all 90 clones for window sizes increasing from 1 to 201 genes (X-axis). This was done using “all-tissue” domain activity data represented by 133 SAGE libraries from different human tissues (black line) and cell-line-specific HEK293 activity measured by Affymetrix microarrays (gray line).


