
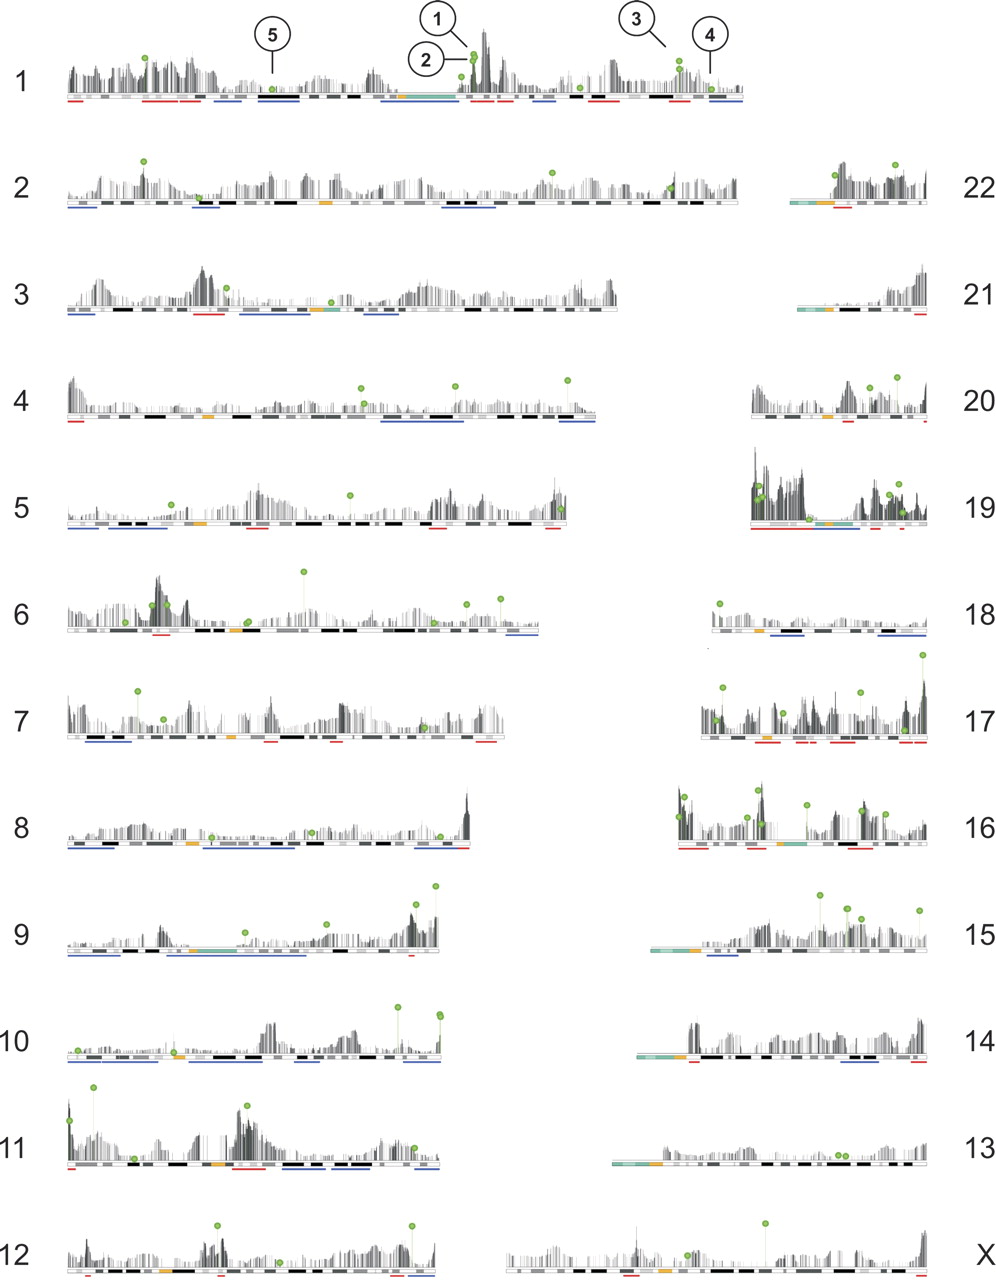
Physically mapped transcriptome profiles of all chromosomes, showing the integration sites and expression levels of all GFP constructs. Giemsa banding is illustrated below each transcriptome map: (yellow) centromere; (green) heterochromatic region; (red) ridges and (blue) anti-ridges are indicated by bars below the Giemsa banding. Black vertical bars represent genes (n = 20,382); their height indicates domain activity for a window of 49 genes (median expression of the surrounding 49 genes in 133 pooled SAGE libraries). Green lollipops indicate integration sites of all GFP constructs (n = 90). The height of each lollipop corresponds to the expression level of the integrated GFP construct. The numbered clones on Chromosome 1 were used for 3D-FISH analysis (see Fig. 6).


