
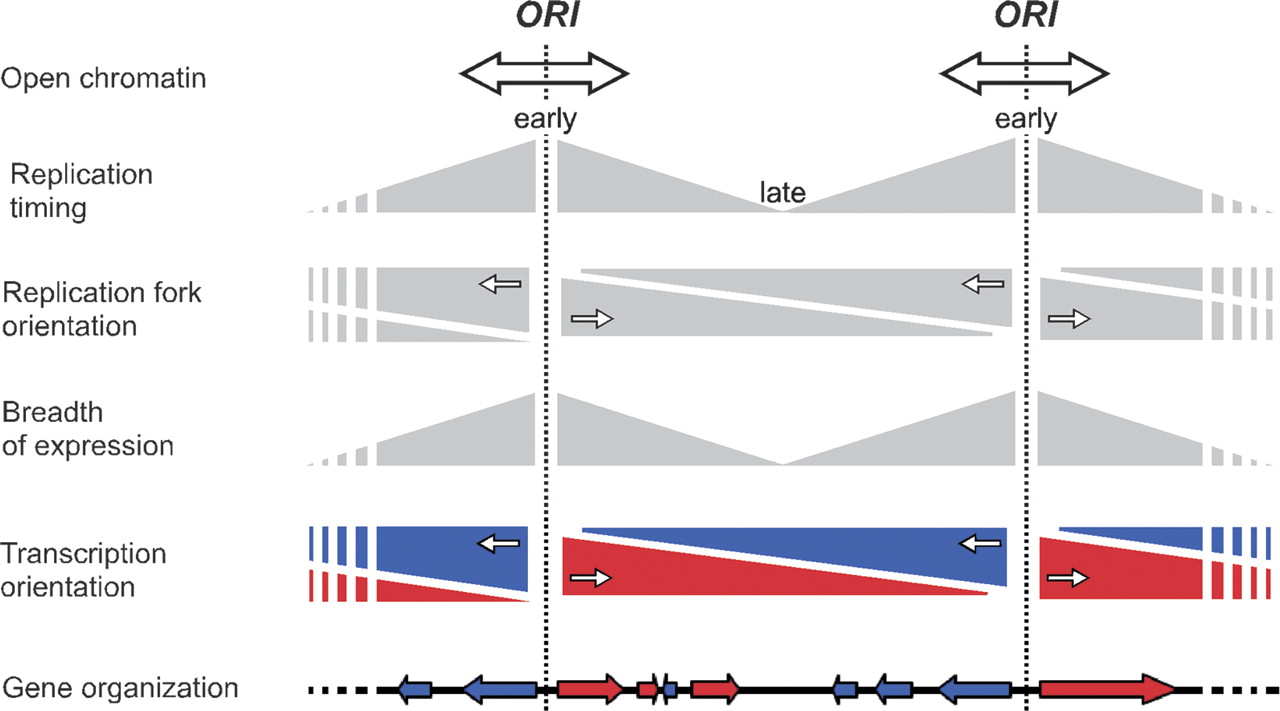
Model of gene organization coordinated by replication and transcription. Two successive putative replication origins (ORI) delineate a replication N-domain. (Open chromatin) Arrows illustrate an open chromatin state at replication origin position; (replication timing) the triangles figure the replication timing values along the N-domain. Replication fork orientation: the triangles indicate the proportion of replication forks progressing from each extremity to the other extremity along the domain (during the successive cell cycles, replication terminates at random sites within the domain). Breadth of expression is maximum near the replication origins and decreases toward the domain center (gray triangles). Transcription orientation: it is preferentially co-oriented with the replication fork progression; the colored triangles indicate the proportion of base pairs along the domain transcribed in the + direction (red) and – direction (blue). Gene organization: red (resp. blue) arrows indicate + (resp. −) genes in the domains.


