
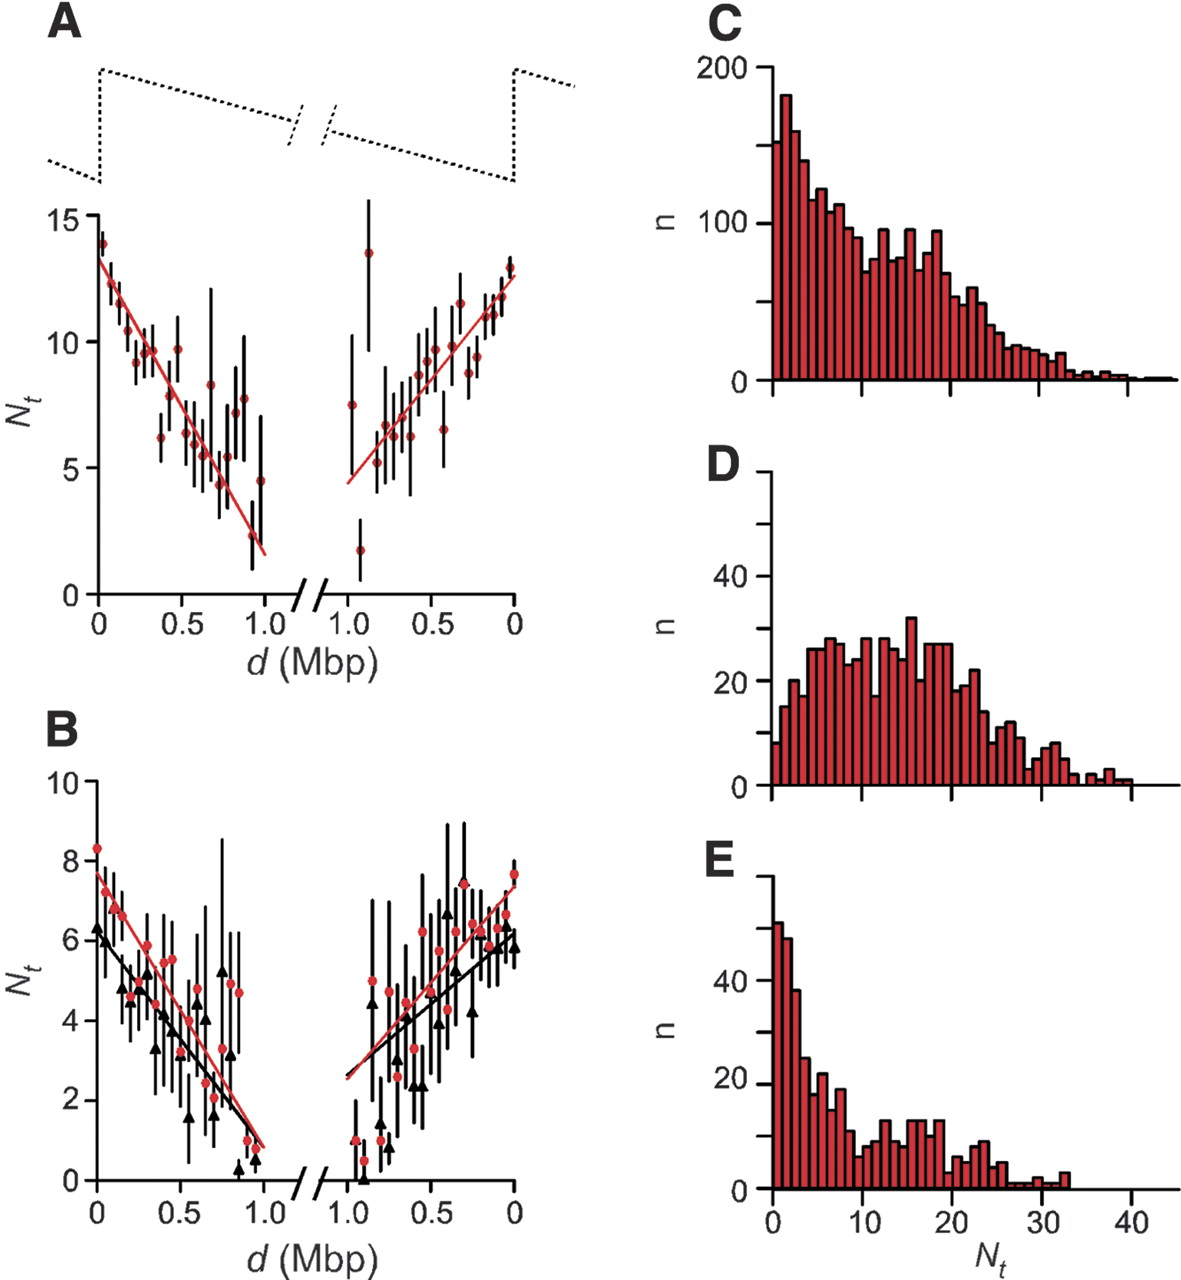
Figure 5.
Expression breadth, Nt, of the genes located in the N-domains. (A) Mean expression breadth calculated using EST data (red). In abscissa, the distance, d, in megabase pairs, to the closest domain extremity. (B) Same as in A with SAGE data (red) and microarray data (black). (C) Histogram of the expression breadth (determined with EST data) of the genes located in the domains. (D) Histogram of the expression breadth of the genes with an extremity (5′ for R+ genes, 3′ for R− genes) located at distance d from the putative replication origins where d < 5% of the length of the half-domain. (E) Same as in D, but with 70% < d < 100%.


