
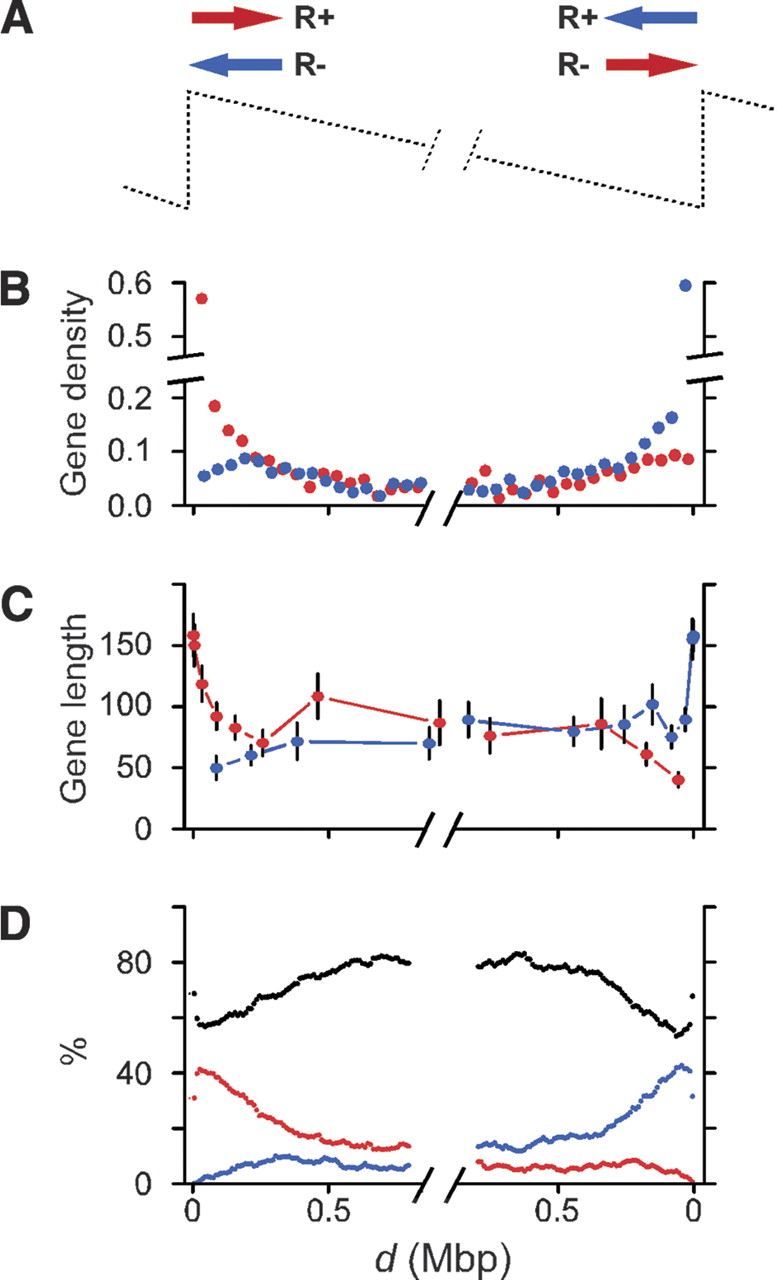
Analysis of the genes located in the N-domains. (A) Arrows indicate the R+ orientation i.e., the same orientation as the most frequent direction of putative replication fork progression; R− orientation (opposed direction); (red) + genes; (blue) − genes. (B) Gene density. The density is defined as the number of 5′ ends (for + genes) or of 3′ ends (for − genes) in 50-kbp adjacent windows, divided by the number of corresponding domains. In abscissa, the distance, d, in megabase pairs, to the closest domain extremity. (C) Mean gene length. Genes are ranked by their distance, d, from the closest domain extremity, grouped by sets of 150 genes, and the mean length (kilobase pairs) is computed for each set. (D) Relative number of base pairs transcribed in the + direction (red), − direction (blue), and nontranscribed (black) determined in 10-kbp adjacent sequence windows.


