
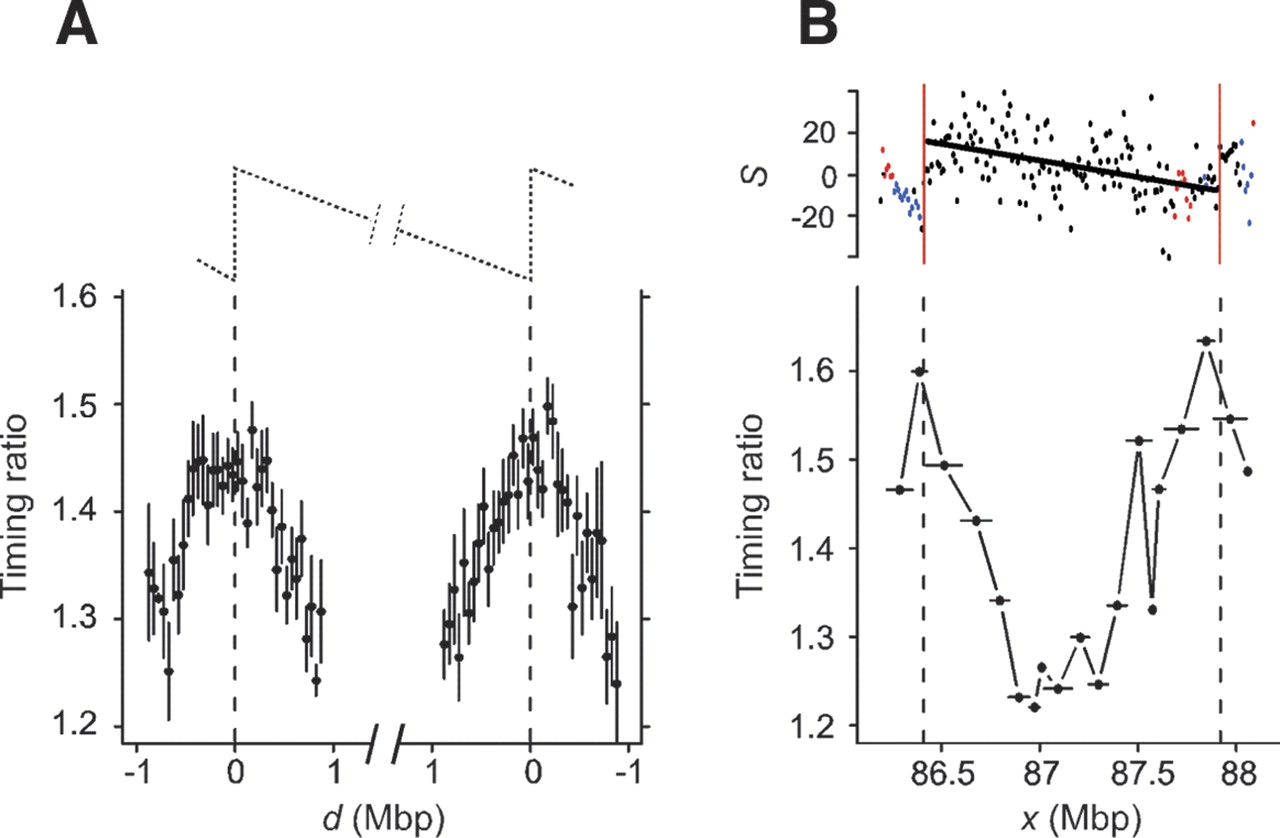
Figure 3.
Replication timing profile of the N-domains. (A) Average replication timing values (±SEM) determined around the extremities of the domains located in chromosome 6; in abscissa, the distance to the indicated 5′ (left) or 3′ (right) closest domain extremity; in ordinate, the mean timing ratio value; data are retrieved from Woodfine et al. (2005). (B) Example of replication timing profile along a complete N-domain. Horizontal bars indicate the DNA probes (∼94 kb) used in the microarray experiments (Woodfine et al. 2005).


