
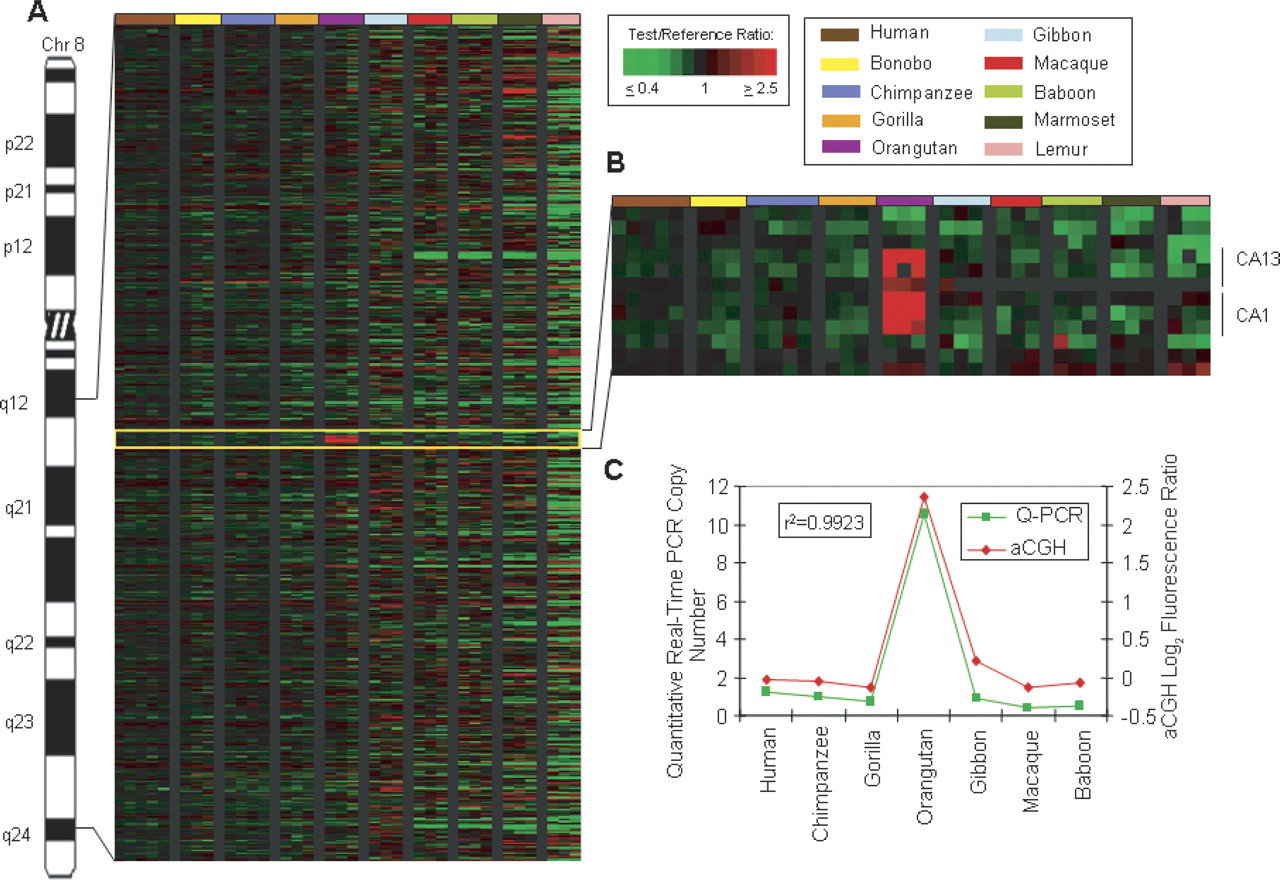
Orangutan-specific amplification of carbonic anhydrase (CA) genes. (A) Human chromosome 8 is shown with a Treeview image corresponding to 8q12.1–q24.1. The Treeview image depicts the aCGH log2 fluorescence ratio in pseudocolor as shown, with green and red signals indicative of a copy number decrease and increase, respectively, relative to human. Each cDNA is ordered according to human genome position. All individuals from one species are color-coded as shown. (B) Enlarged Treeview image of an orangutan LS increase involving a block of six contiguous amplified cDNA signals, including three cDNAs corresponding to the carbonic anhydrase 13 (CA13) gene and three cDNAs correlating to the carbonic anhydrase 1 (CA1) gene. (C) The graph shows the aCGH log2 fluorescence ratio (red) plotted against the Q-PCR values (green) for the CA genes for 10 primate species. The correlation coefficient for the two data sets is r2 = 0.9923.


