
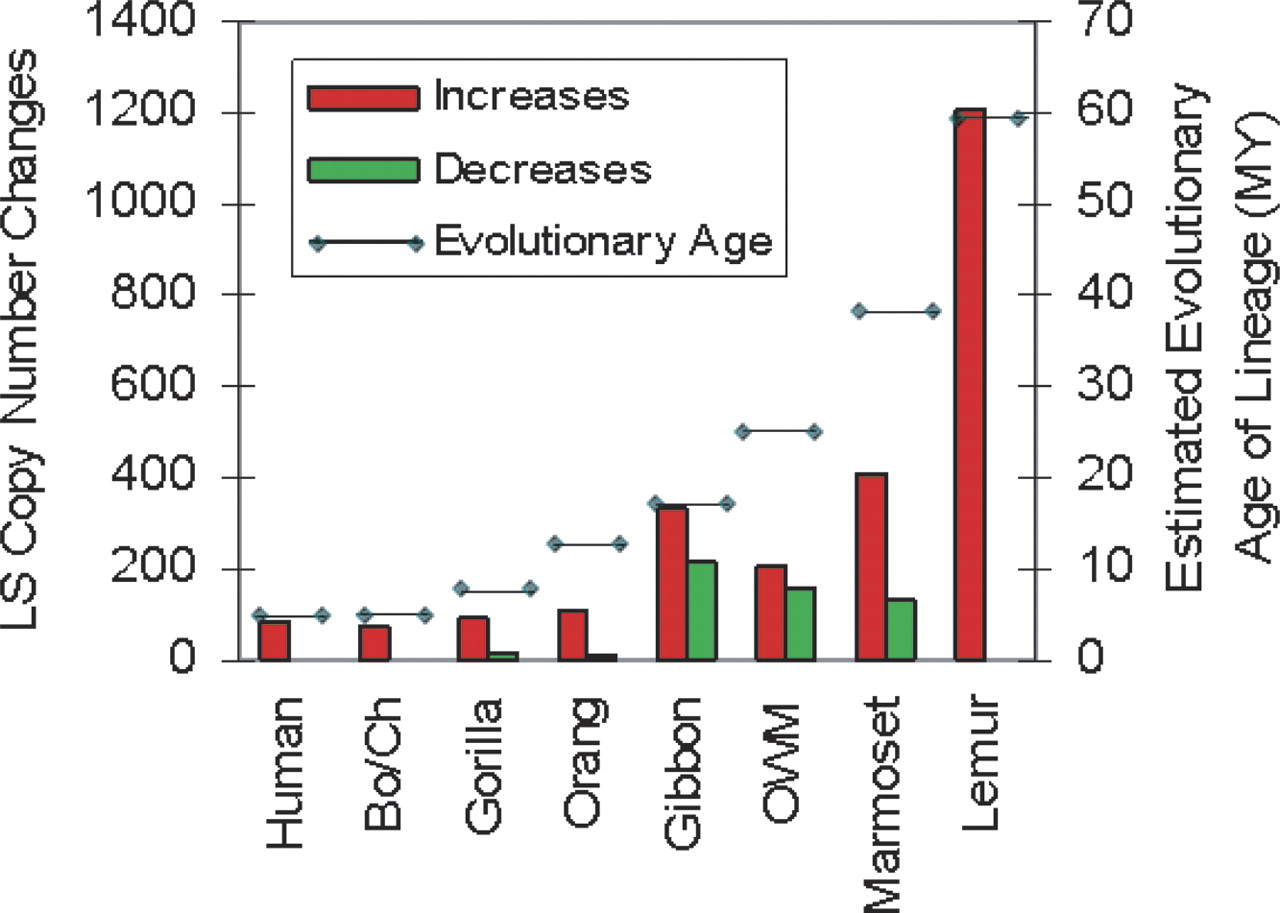
LS increases and decreases and corresponding evolutionary age of each lineage. The total number of LS increases and decreases is shown as red and green bars, representing copy number gains and losses, respectively. The number of increases/decreases for each lineage is as follows: human 84/0, Pan lineage 75/4, gorilla 88/14, orangutan 107/10, gibbon 336/213, OWM (baboon and macaque combined) 211/158, marmoset 408/135, and lemur 1209/3530.The evolutionary age of each lineage in millions of years (depicted by the horizontal line) refers to the approximate divergence times from a last common ancestor with the human lineage and is the same as described in Figure 1.


