
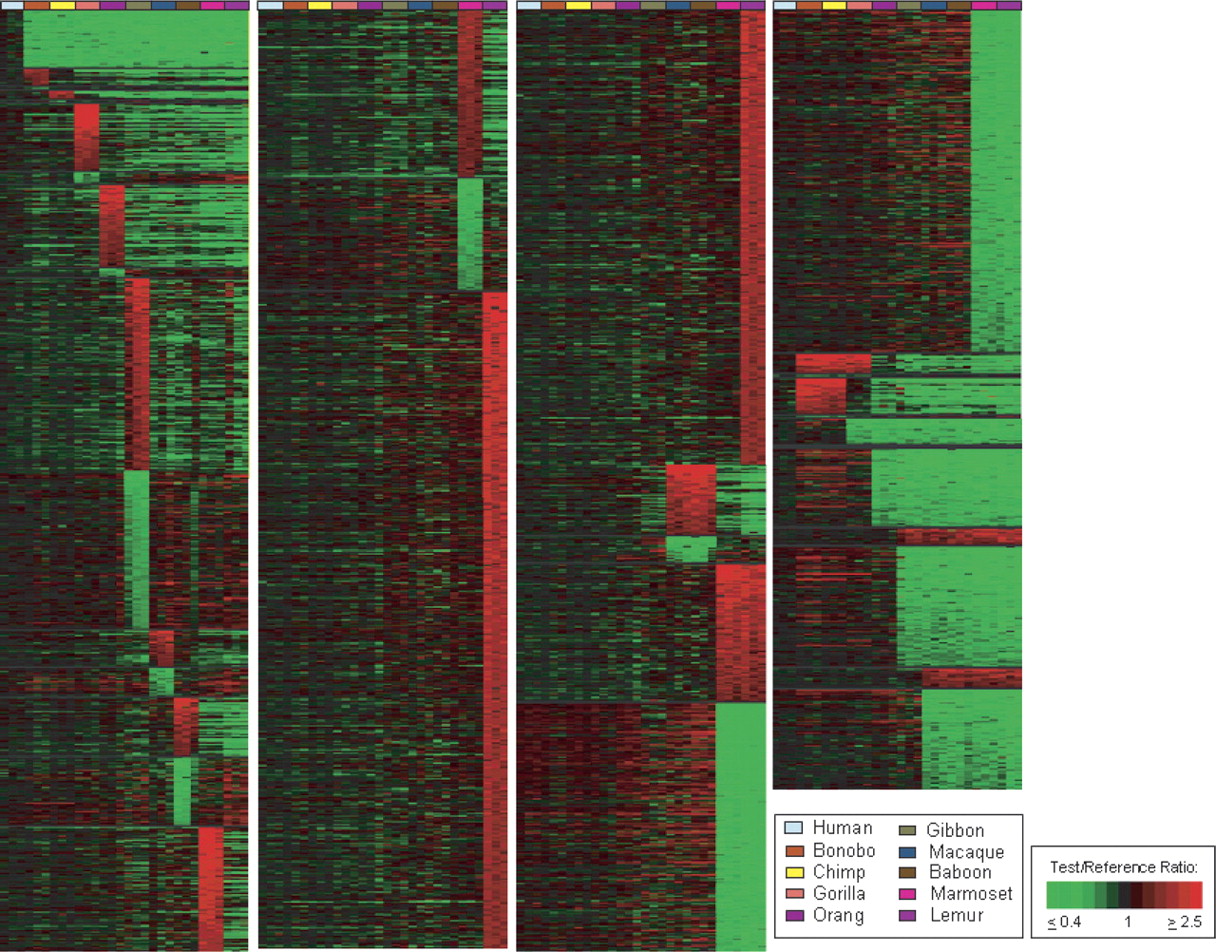
Treeview image of genes showing lineage-specific copy number changes among 10 primate species. Treeview image of 7318 genes giving LS aCGH signatures are shown for each of 10 lineages, including human (blue-gray), bonobo (rust), chimp (yellow), gorilla (orange), orangutan (purple), gibbon (green), macaque (blue), baboon (brown), marmoset (magenta), and lemur (light purple), as well as Old World Monkeys (OWM), marmoset and lemur, African Great Apes, Pan lineage (bonobo and chimp together), and combined aCGH-predicted changes relative to the remaining extended primates for the following groups: human and Pan lineage, human and African great apes, human and great apes, and human and all apes (great and lesser). The LS signals are grouped according to lineage and within each lineage are ordered, highest to lowest, according to the log2 fluorescence ratio of the signal intensity of test sample to reference sample. Colors are displayed using a pseudocolor scale as shown. The green signals indicate LS decreases with respect to human, and the red signals indicate LS increases with respect to human.


