
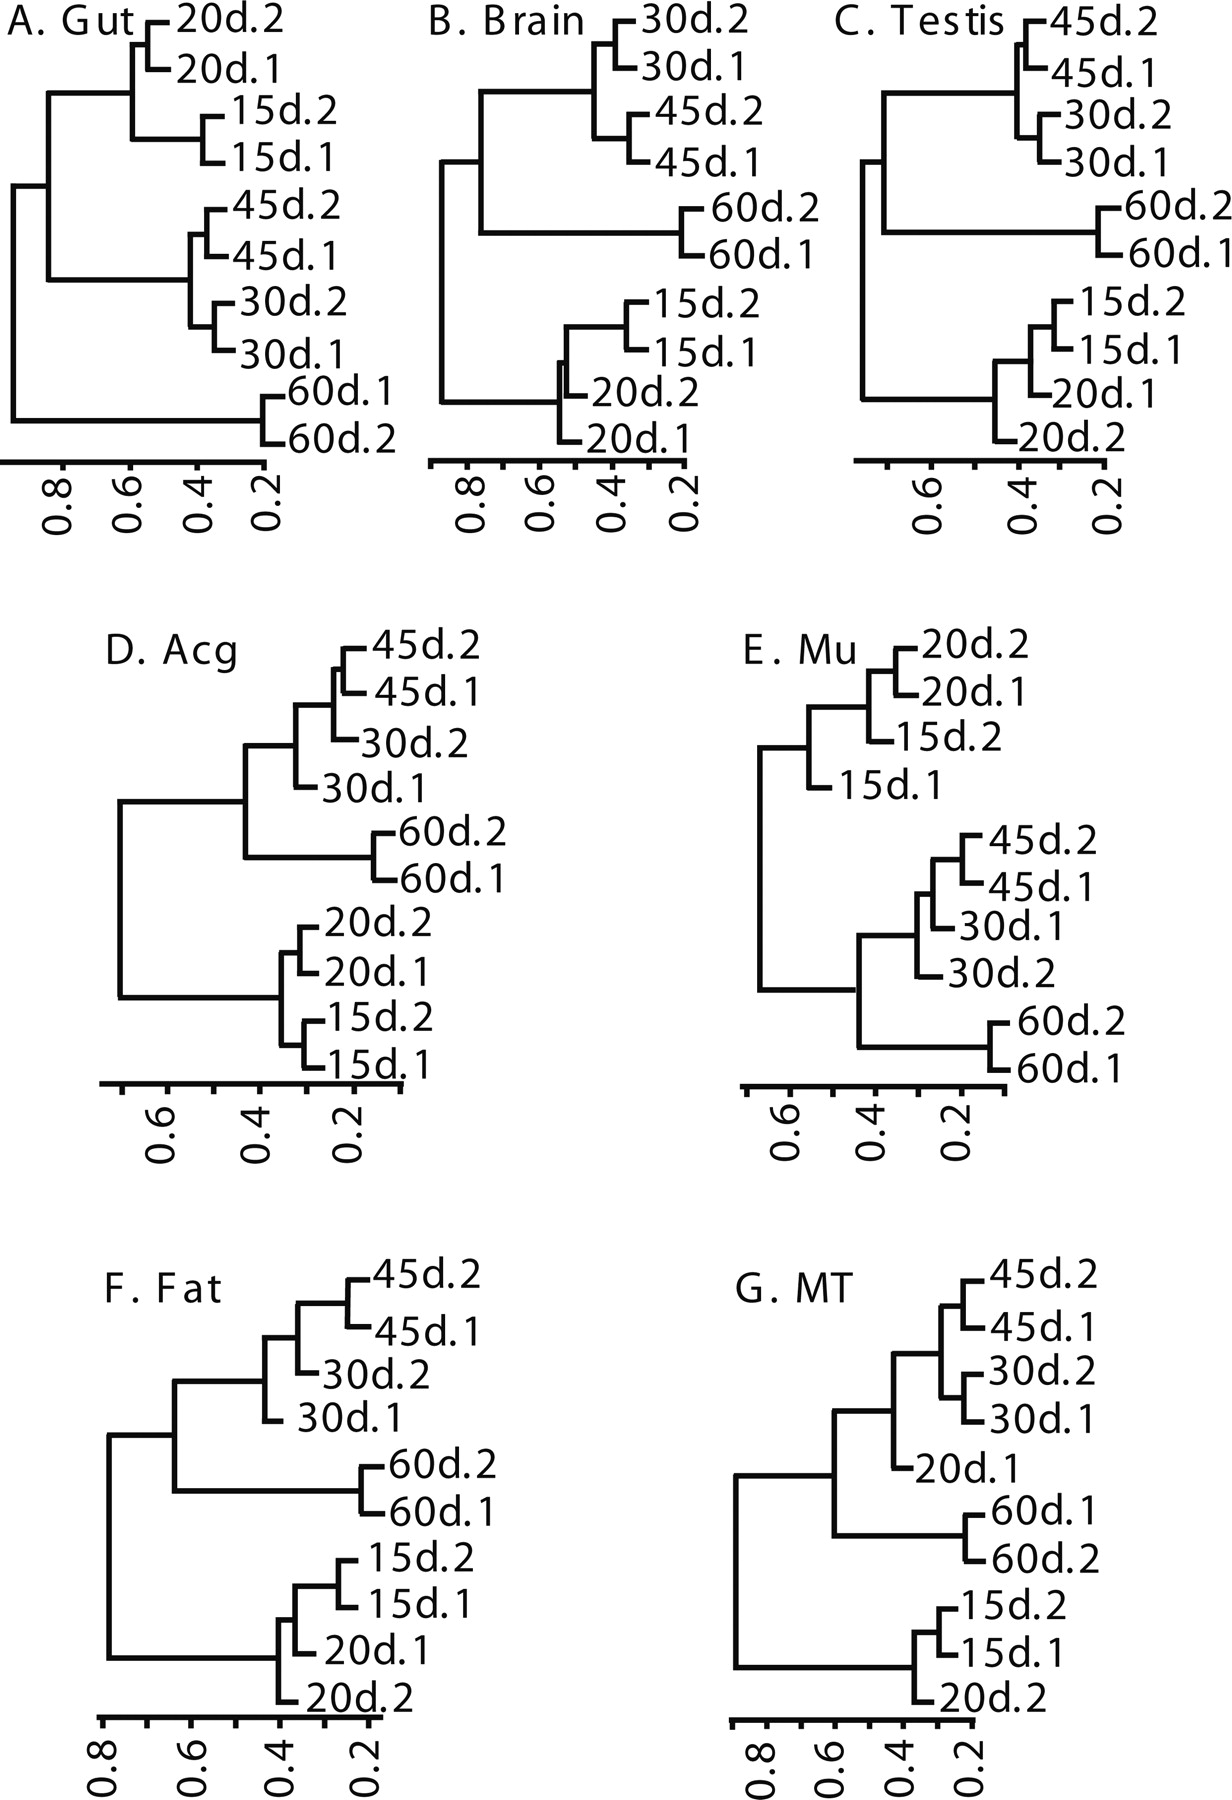
Figure 4.
Hierarchical clustering analysis of temporal transcriptional profiles of individual tissues using the age-related genes. In each tissue, the difference of transcriptomic data at different ages is reflected by the distance scale bar shown at the bottom of each cluster dendrogram. Each branch represents one age-point labeled in the order of age, tissue type, and data set identification. (A) Gut; (B) brain; (C) testis; (D) Acg; (E) muscle; (F) fat; (G) MT.


