
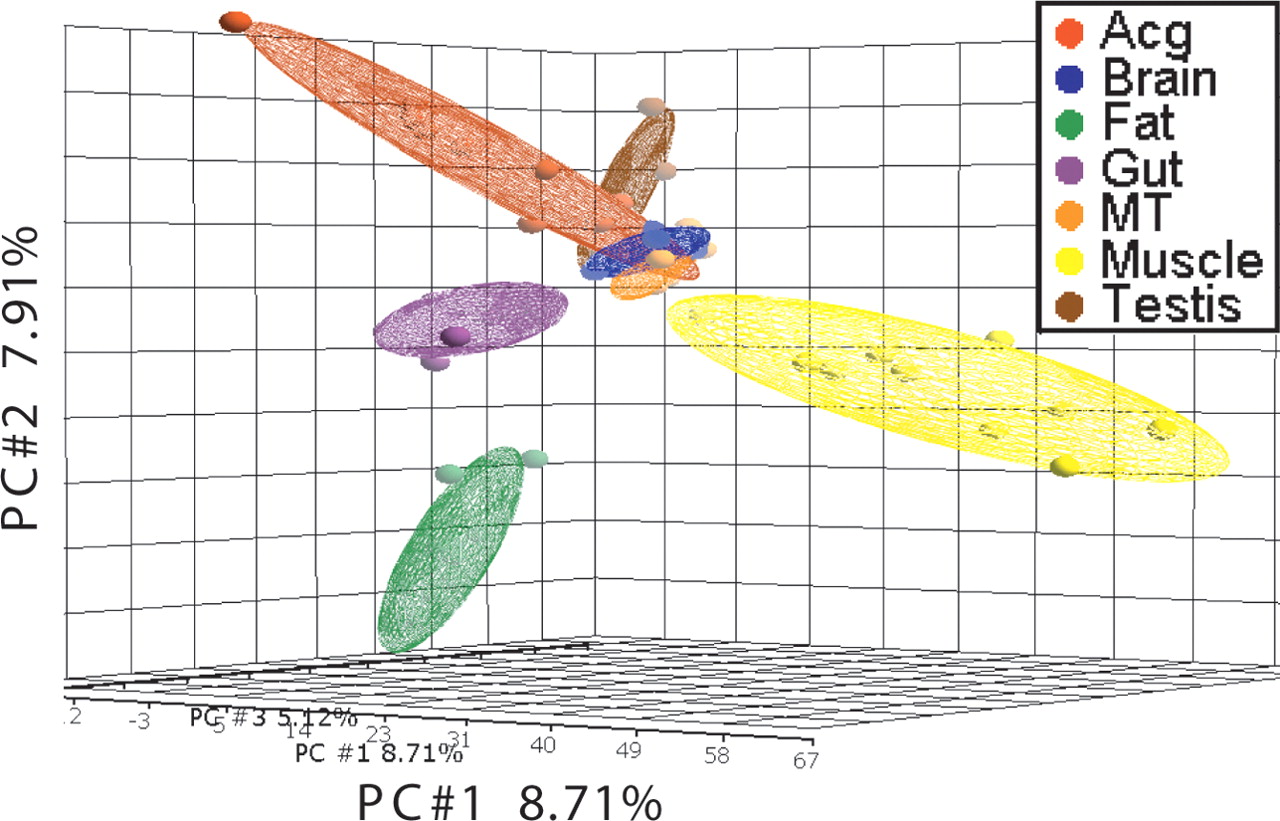
Figure 3.
PCA maps were generated with the age-related genes showing relationships of transcriptional profiles of aging among different tissues. The amount of variation covered by the top three principle components are as follows: (#1) 8.71%; (#2) 7.91%; (#3) 5.12%. The samples of seven tissues are color-coded. Each small sphere represents projection of one age sample from one tissue in the three-dimensional space formed by the top three principle components. Each large oval represents the area covered by all the samples of one tissue formed by the small spheres.


