
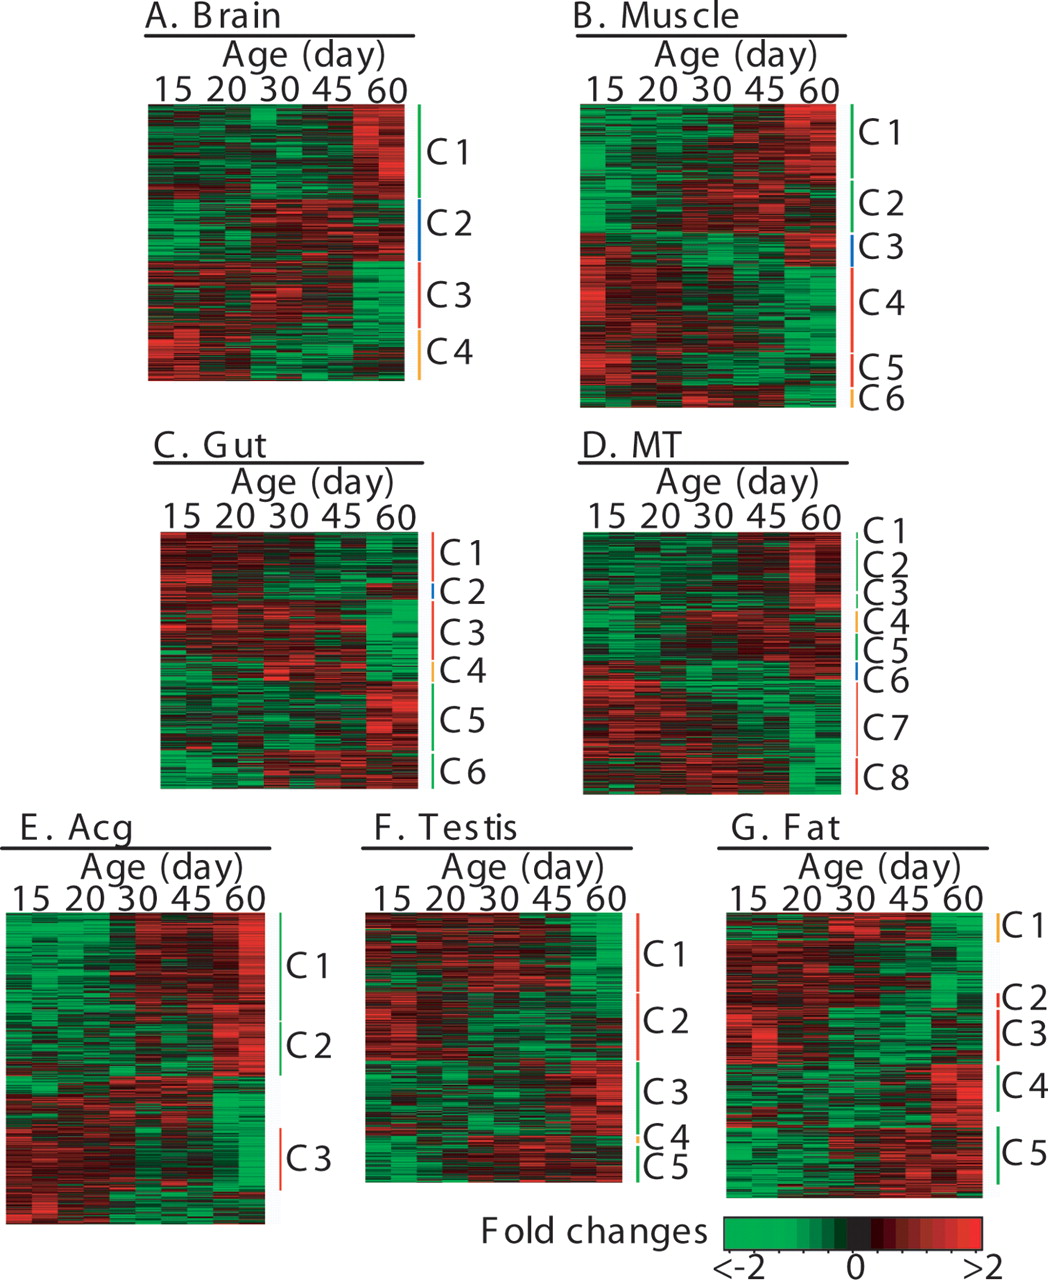
Heat map presentation of expression patterns of the age-related genes in each tissue. (A) Brain; (B) muscle; (C) gut; (D) MT; (E) Acg; (F) testis; (G) adipose tissue. Each column represents an age-point. Each row represents the expression pattern of one gene across all the age-points. The ratios of transcript levels between experiment and reference samples are color-coded in red and green. Red represents an increase of the transcript level of a gene in the experiment samples aged 15–60 d compared with the 3-d-old reference sample, and green represents a decrease. The age-related genes in each tissue are grouped to three to eight clusters (labeled as C1 to C8) by hierarchical clustering analysis based on their similarities in expressional profiles.


