
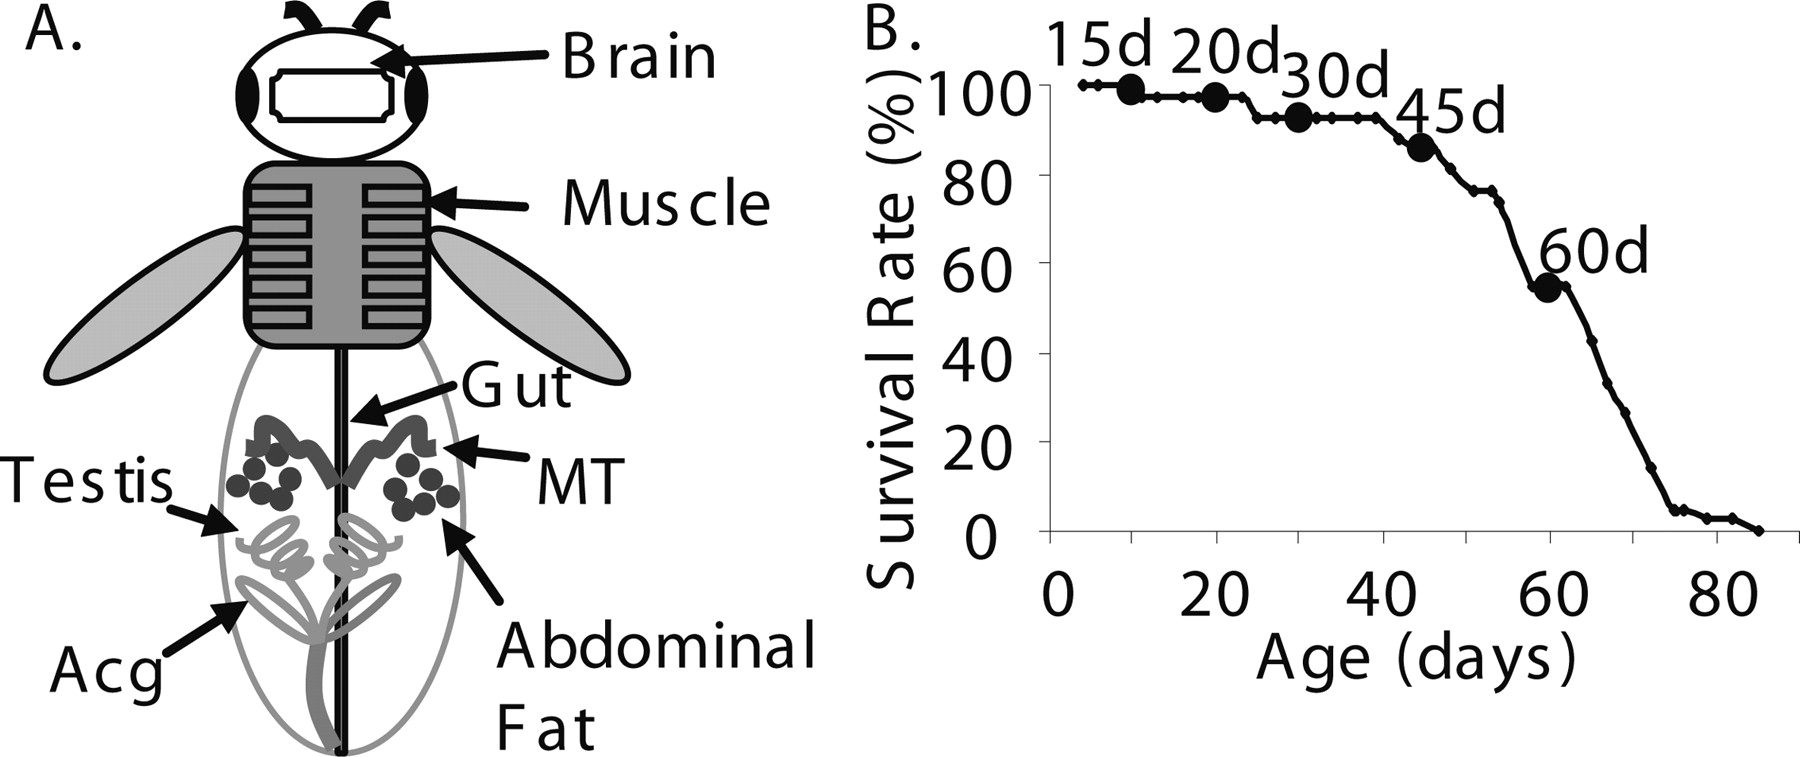
Figure 1.
Fly tissues for microarray experiments. (A) RNA samples for microarray experiments were prepared from seven tissues shown in the fly image. (B) Lifespan curve of w1118. The mean lifespan of w1118 at 25°C was 59.2 ± 2.3 d. The age-points labeled on the curve represent ages of males when tissues were collected for microarray experiments.


