
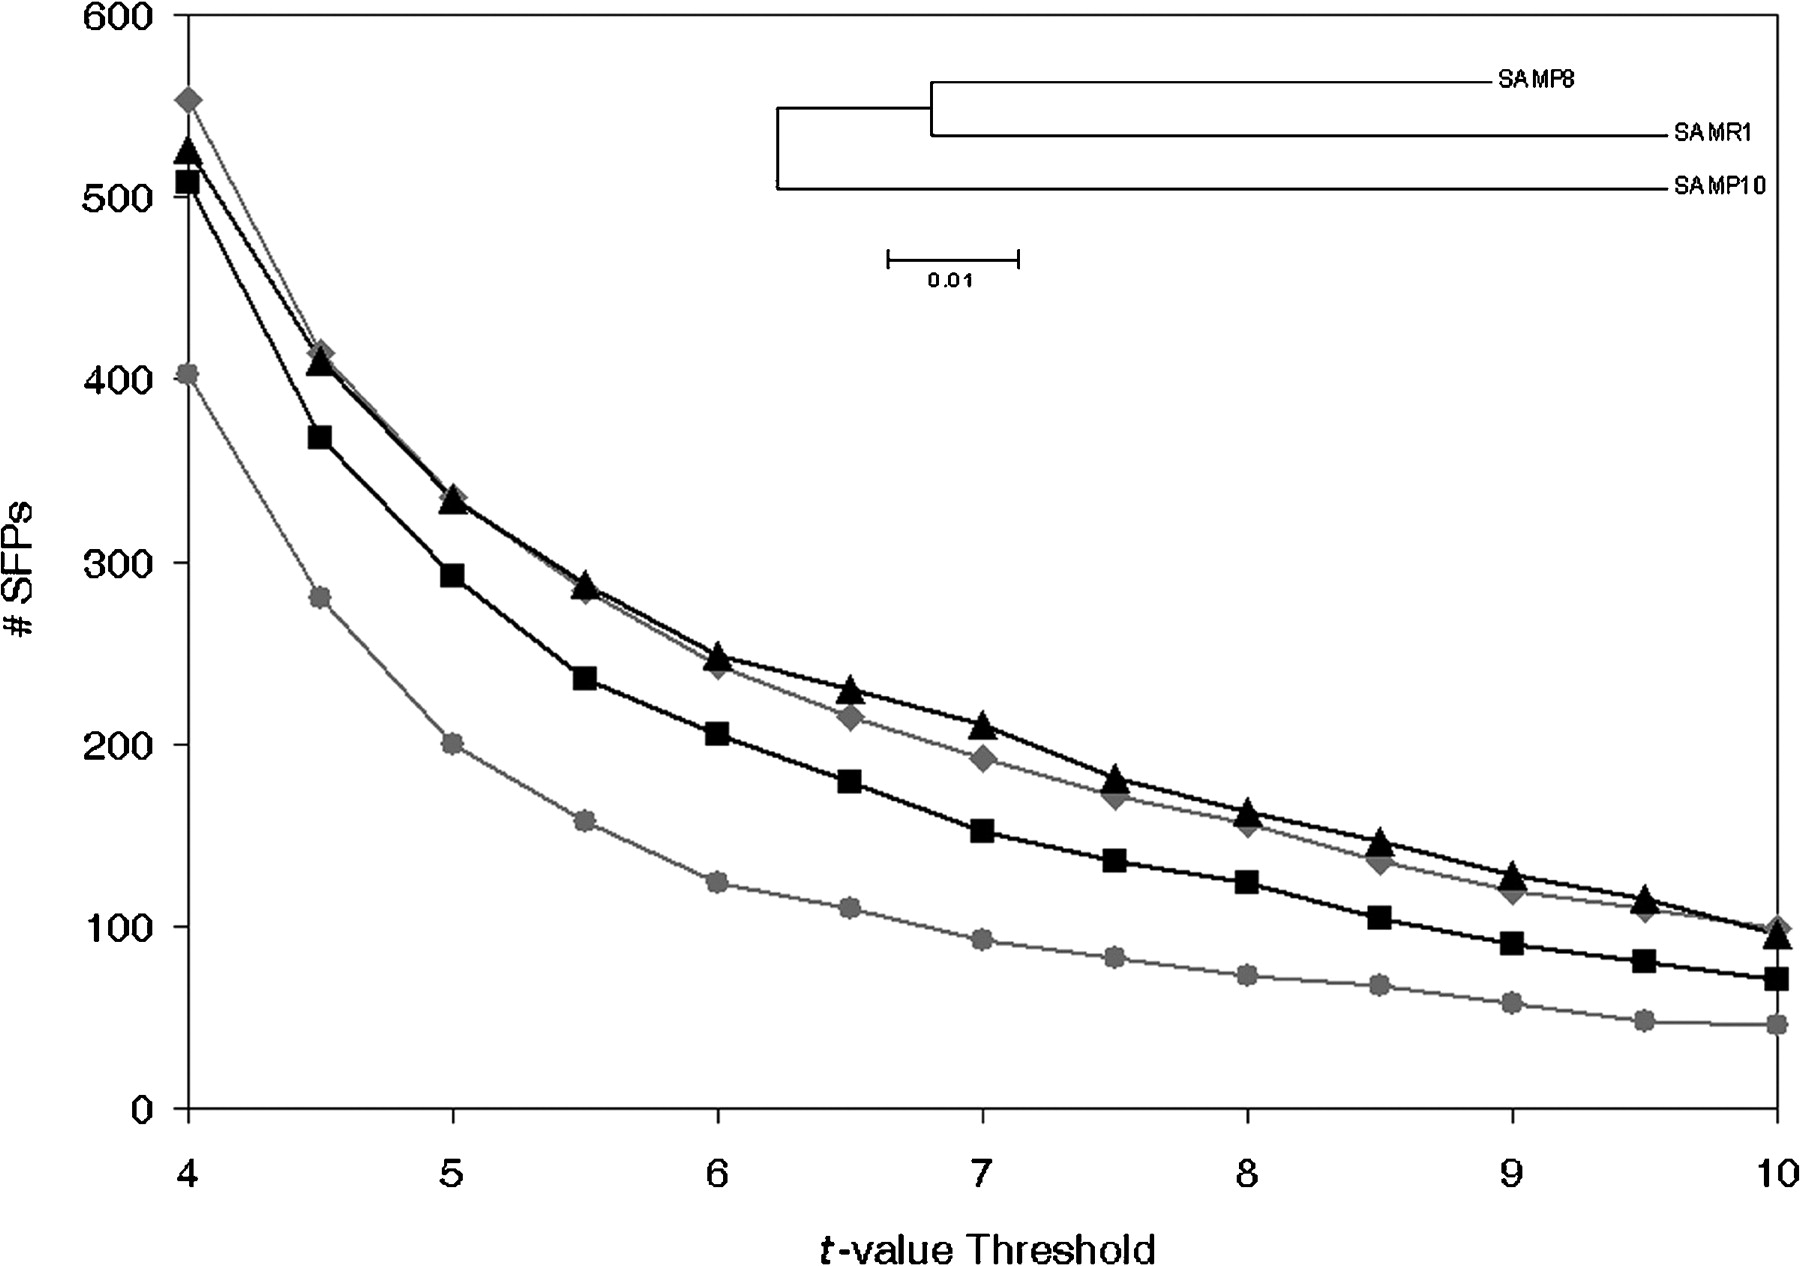
Sequence differences between SAM strains. GeSNP comparisons using the three SAM strains are shown. The Y-axis represents the number of SFPs occurring at a given t-value, and the X-axis shows several t-value thresholds. (Black squares) SAMP8 to SAMR1 comparison, (gray diamonds) SAMP10 to SAMR1 comparison, (black triangles) SAMP10 to SAMP8 comparison, (gray circles) comparison of SAMP8 and SAMP10 to SAMR1, uncovering SAMP8 and SAMP10 common, shared differences. The divergence in the number of SFPs is consistent with the phylogenetic distance between strains that has been found by microsatellite studies (Xia et al. 1999) and SNP genotyping (Cervino et al. 2005). All the non-monomorphic SNPs (1907) of Cervino et al. (2005) were used to generate the phylogenetic tree shown inside the graph using the neighbor-joining option of the MEGA3 software (Kumar et al. 2004).


