
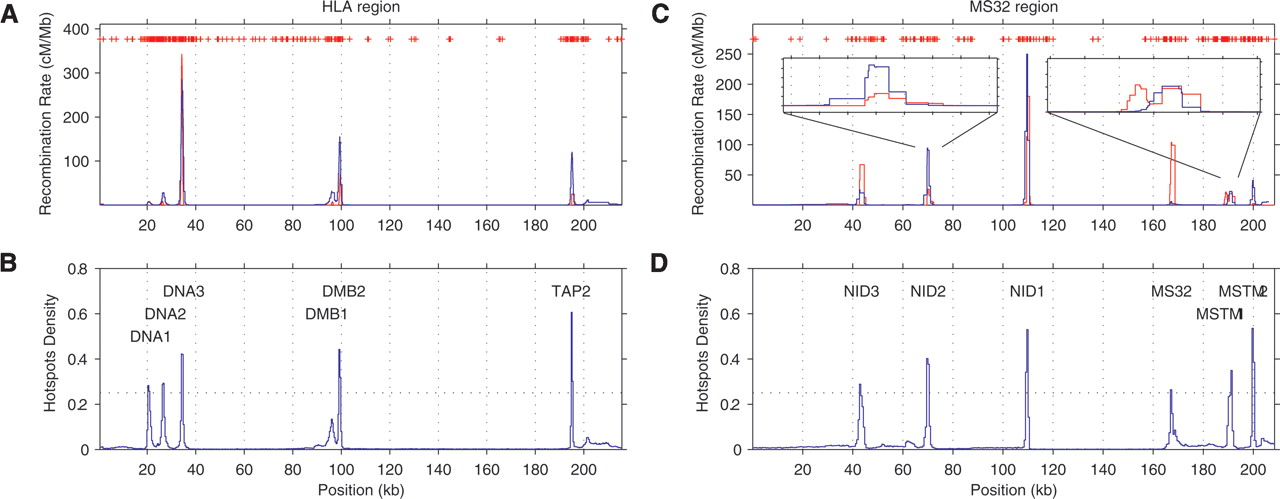
Figure 6.
Output of rhomap for the HLA and MS32 regions. Plots A and C show the recombination rate estimates of the HLA and MS32 regions respectively, with the estimated rate in blue, and (sex-averaged) sperm typing rate in red. SNP locations are shown as red marks. Estimates from rhomap were converted to cM/Mb by assuming Ne = 10,000. Also shown in plot C is the detail of the NID2a/b and MSTM1a/b estimates. Plots B and D show the average number of hotspots per sample per kb for the same regions.


