
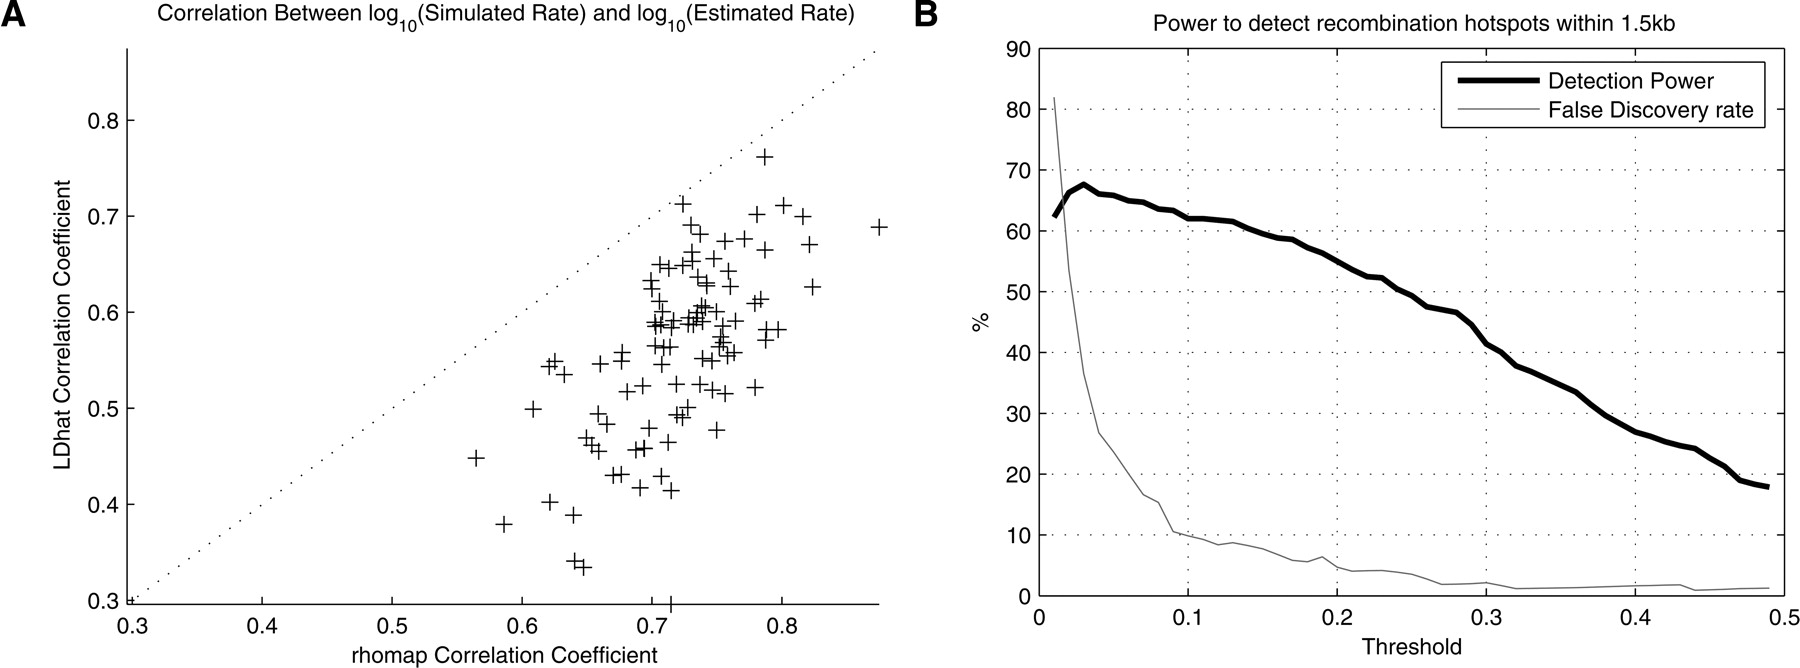
Results from Simulation Study B. (A) Correlation coefficient between the log10 estimated rate and the log10 simulated rate for 100 data sets, as measured over SNP intervals. The correlation coefficients obtained using rate estimates from LDhat are shown on the vertical axis, and the coefficients obtained using rhomap are shown on the horizontal axis. (B) Using rhomap as a hotspot detection tool in the variable rate simulation study. This plot shows the power of rhomap to detect recombination hotspots (thick line) and the false-discovery rate (thin line). Hotspots were called if the average number of hotspots per sample per kb at a local maxima was above the threshold shown on the horizontal axis. The hotspot was considered to be correctly detected if it was within 1.5 kb of the location of a simulated hotspot. Otherwise, the hotspot was considered a false positive.


