
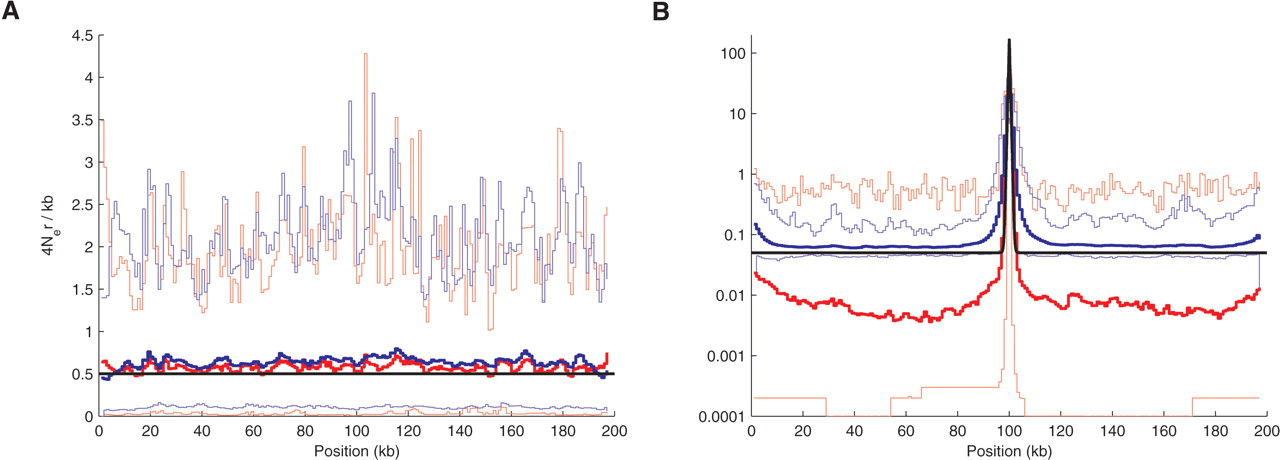
Figure 3.
Average recombination rate estimates from 100 simulated data sets. (A) Results from Simulation Study A with a constant recombination rate. (B) Results from Simulation Study C with an active central hotspot. Rate estimates from LDhat and rhomap are shown as thick red and blue lines, respectively. The simulated recombination profile is shown in black. The 2.5th and 97.5th percentiles of the estimated rates are shown in faded colors. Note that, for clarity, the constant rate simulation estimates are shown on a linear scale, whereas the hotspot simulation estimates are shown on a logarithmic scale.


