
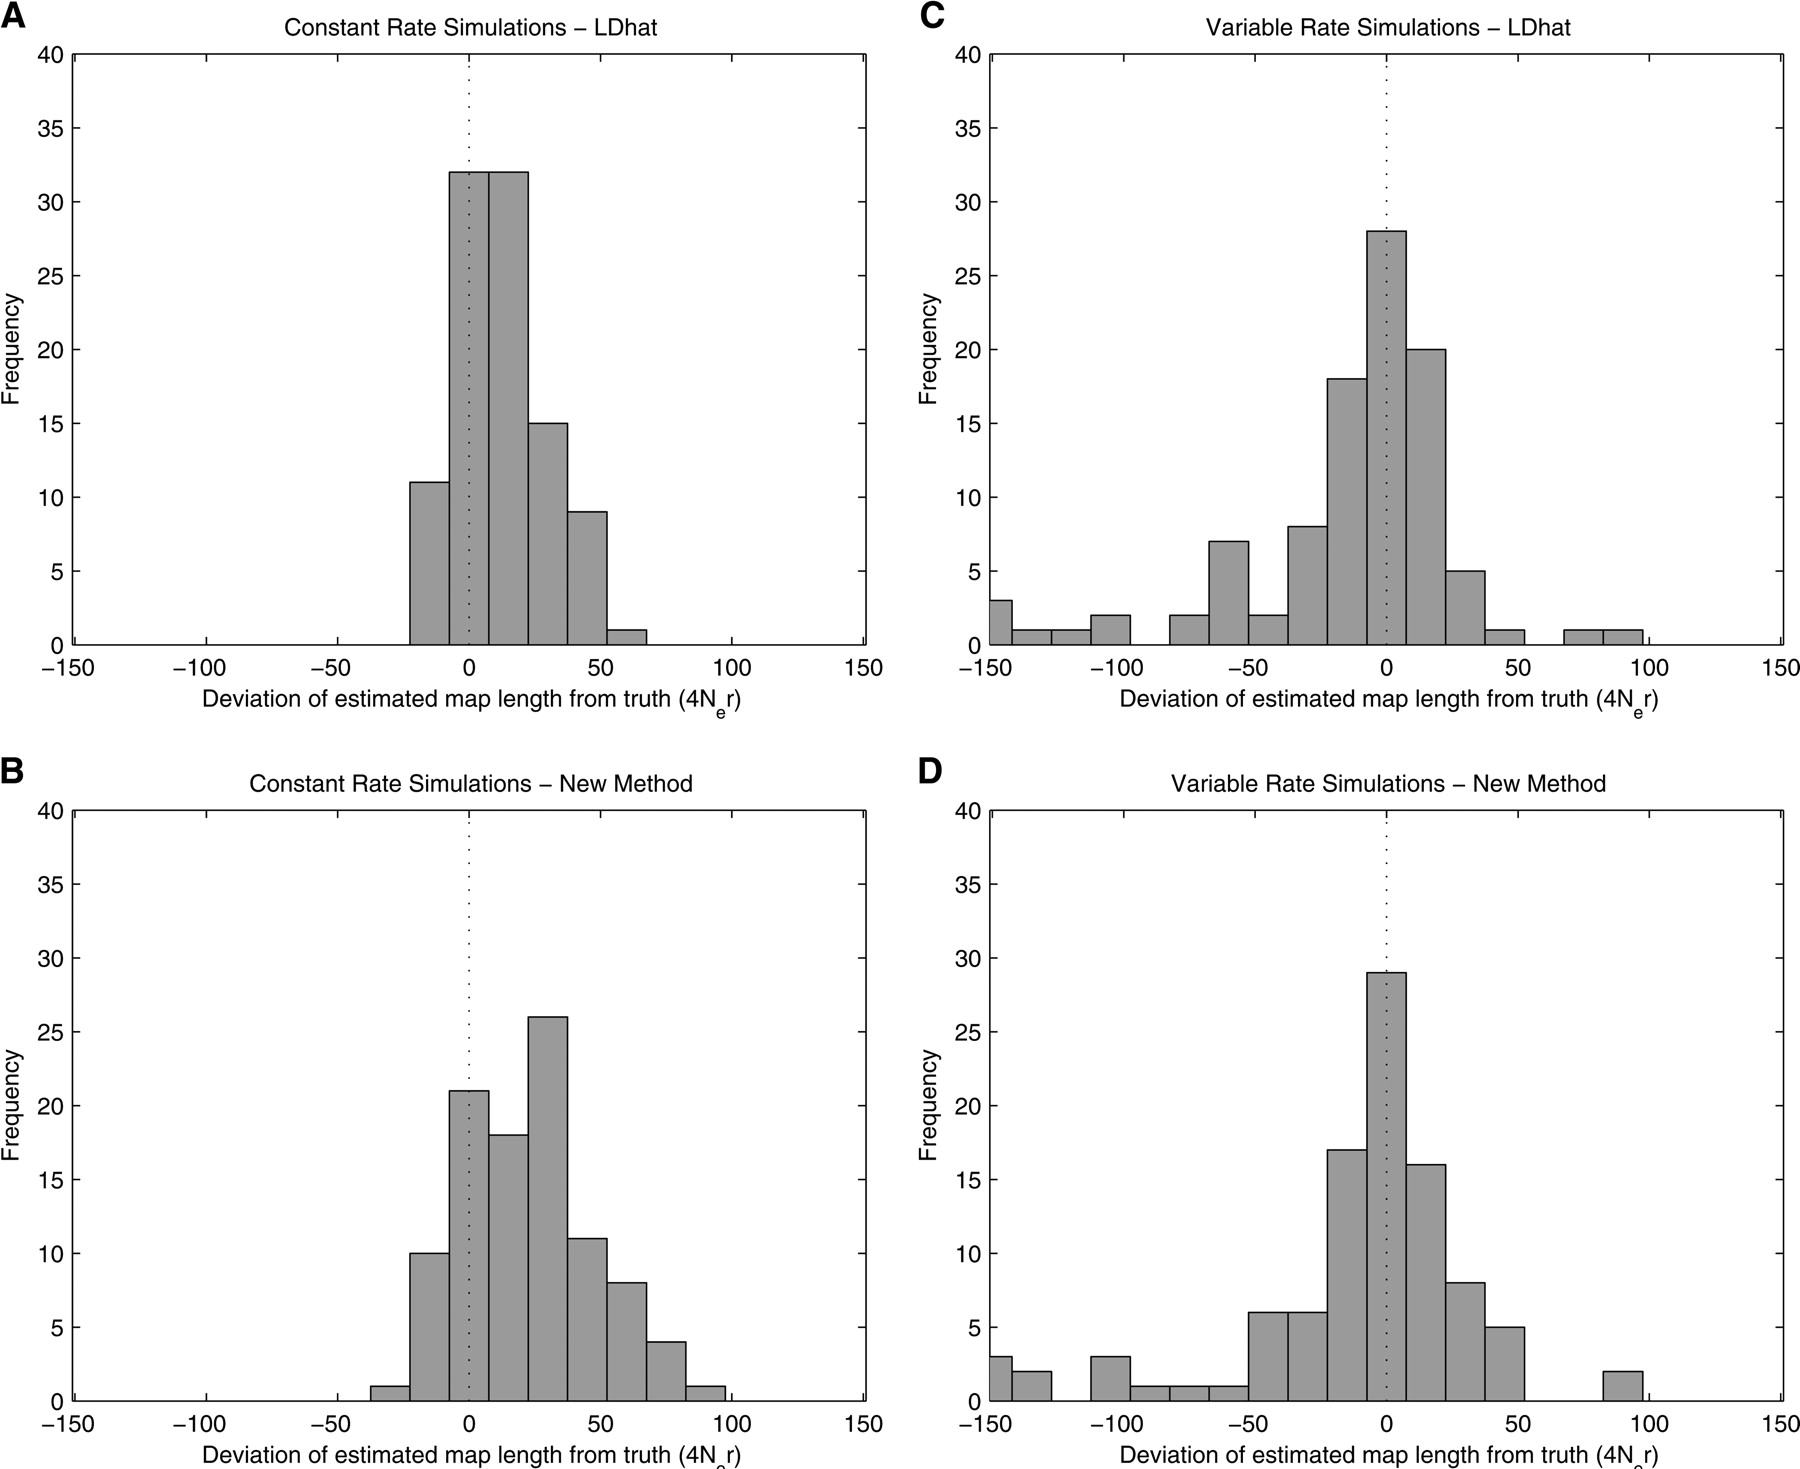
Figure 2.
Deviation of the estimated total ρ from the simulated value. Rate estimates from the constant rate simulations (Simulation Study A) using LDhat and rhomap are shown in A and B, respectively. Rate estimates from the variable rate simulations (Simulation Study B) using LDhat and rhomap are shown in C and D, respectively.


