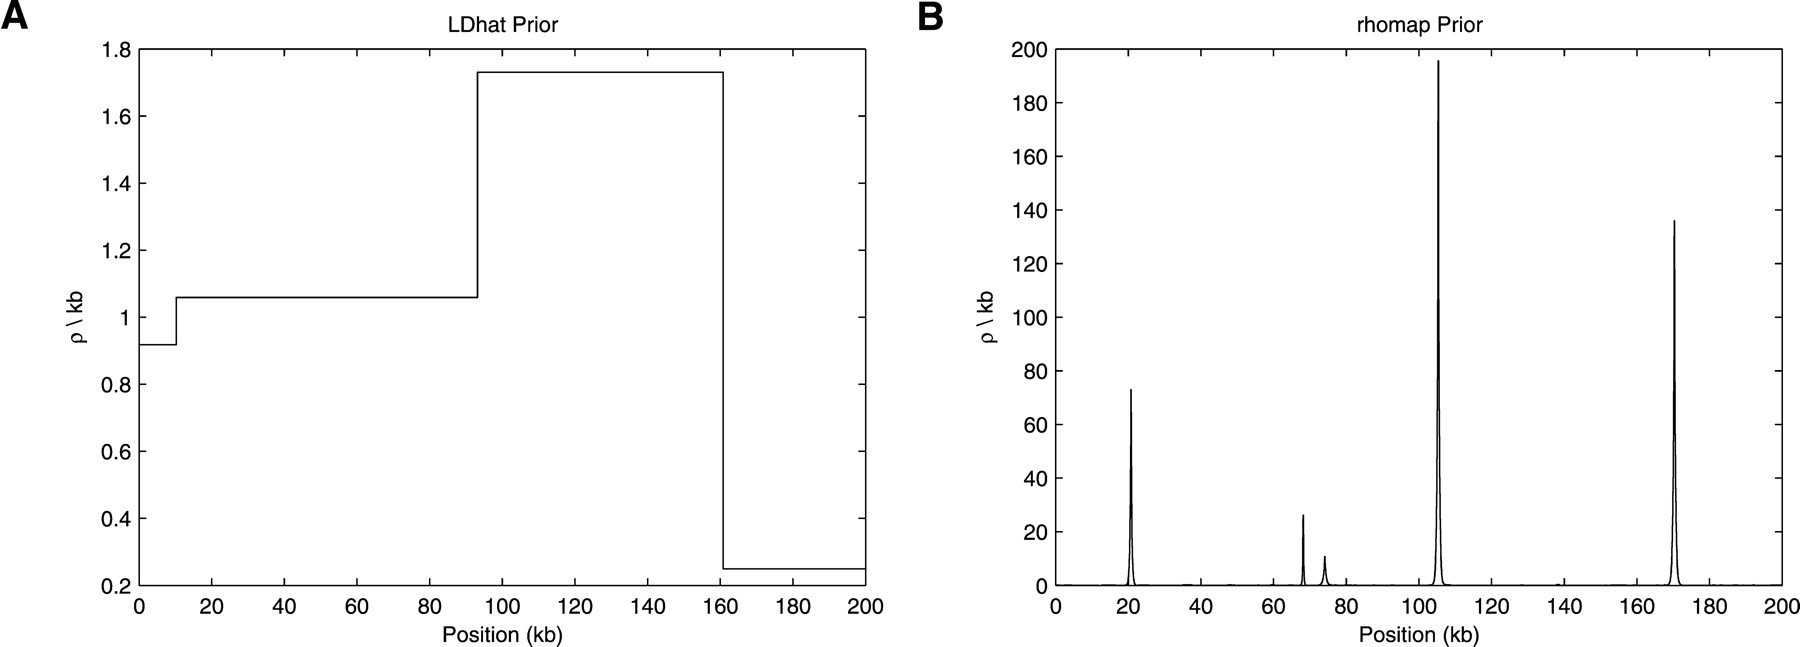
Recombination rate estimation in the presence of hotspots

(Downloading may take up to 30 seconds. If the slide opens in your browser, select File -> Save As to save it.)

Click on image to view larger version.

Figure 1.
Figure 1.

Illustration of the priors of LDhat (A) and rhomap (B). Shown here are individual realizations of the priors for a 200-kb region. Note the difference in the Y-axis scales.

This Article

  1. Genome Res. 17: 1219-1227

Preprint Server