
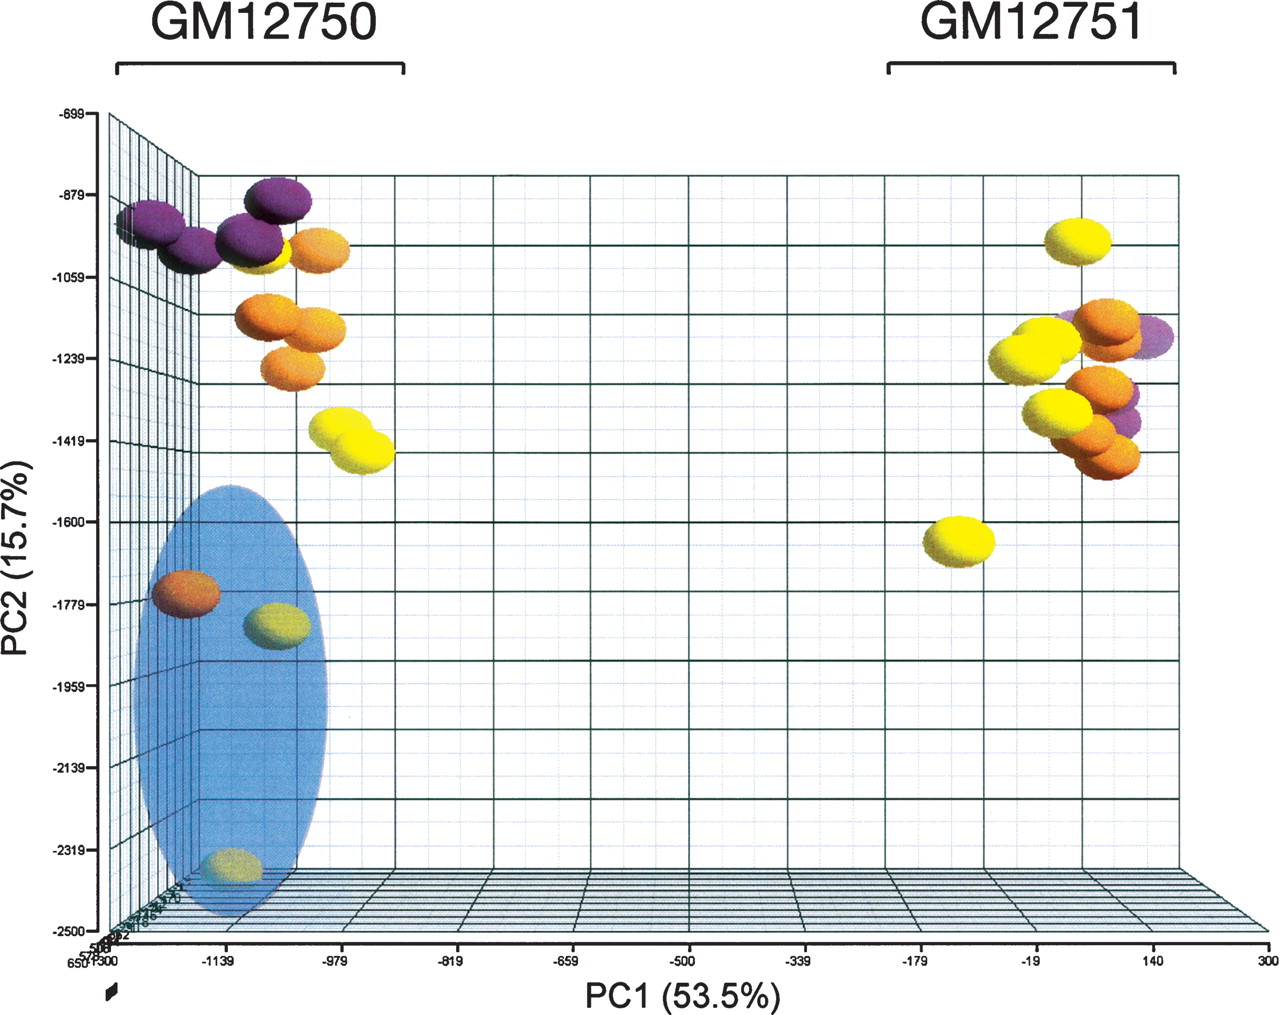
Figure 2.
Principal component analysis. A three-dimensional plot of the splicing index data showing the three passages of five technical replicates each of individuals GM12750 and GM12751, on the left and right sides, respectively. The three biological replicates are shown as purple, orange, and yellow spheres, respectively. The three outliers that were removed from all subsequent analyses are shaded in a blue sphere. The percentage of variance attributed to principal components one and two is shown on the X- and Y-axes, respectively. Plots were created using the Partek Genomics Suite software package (Partek).


