
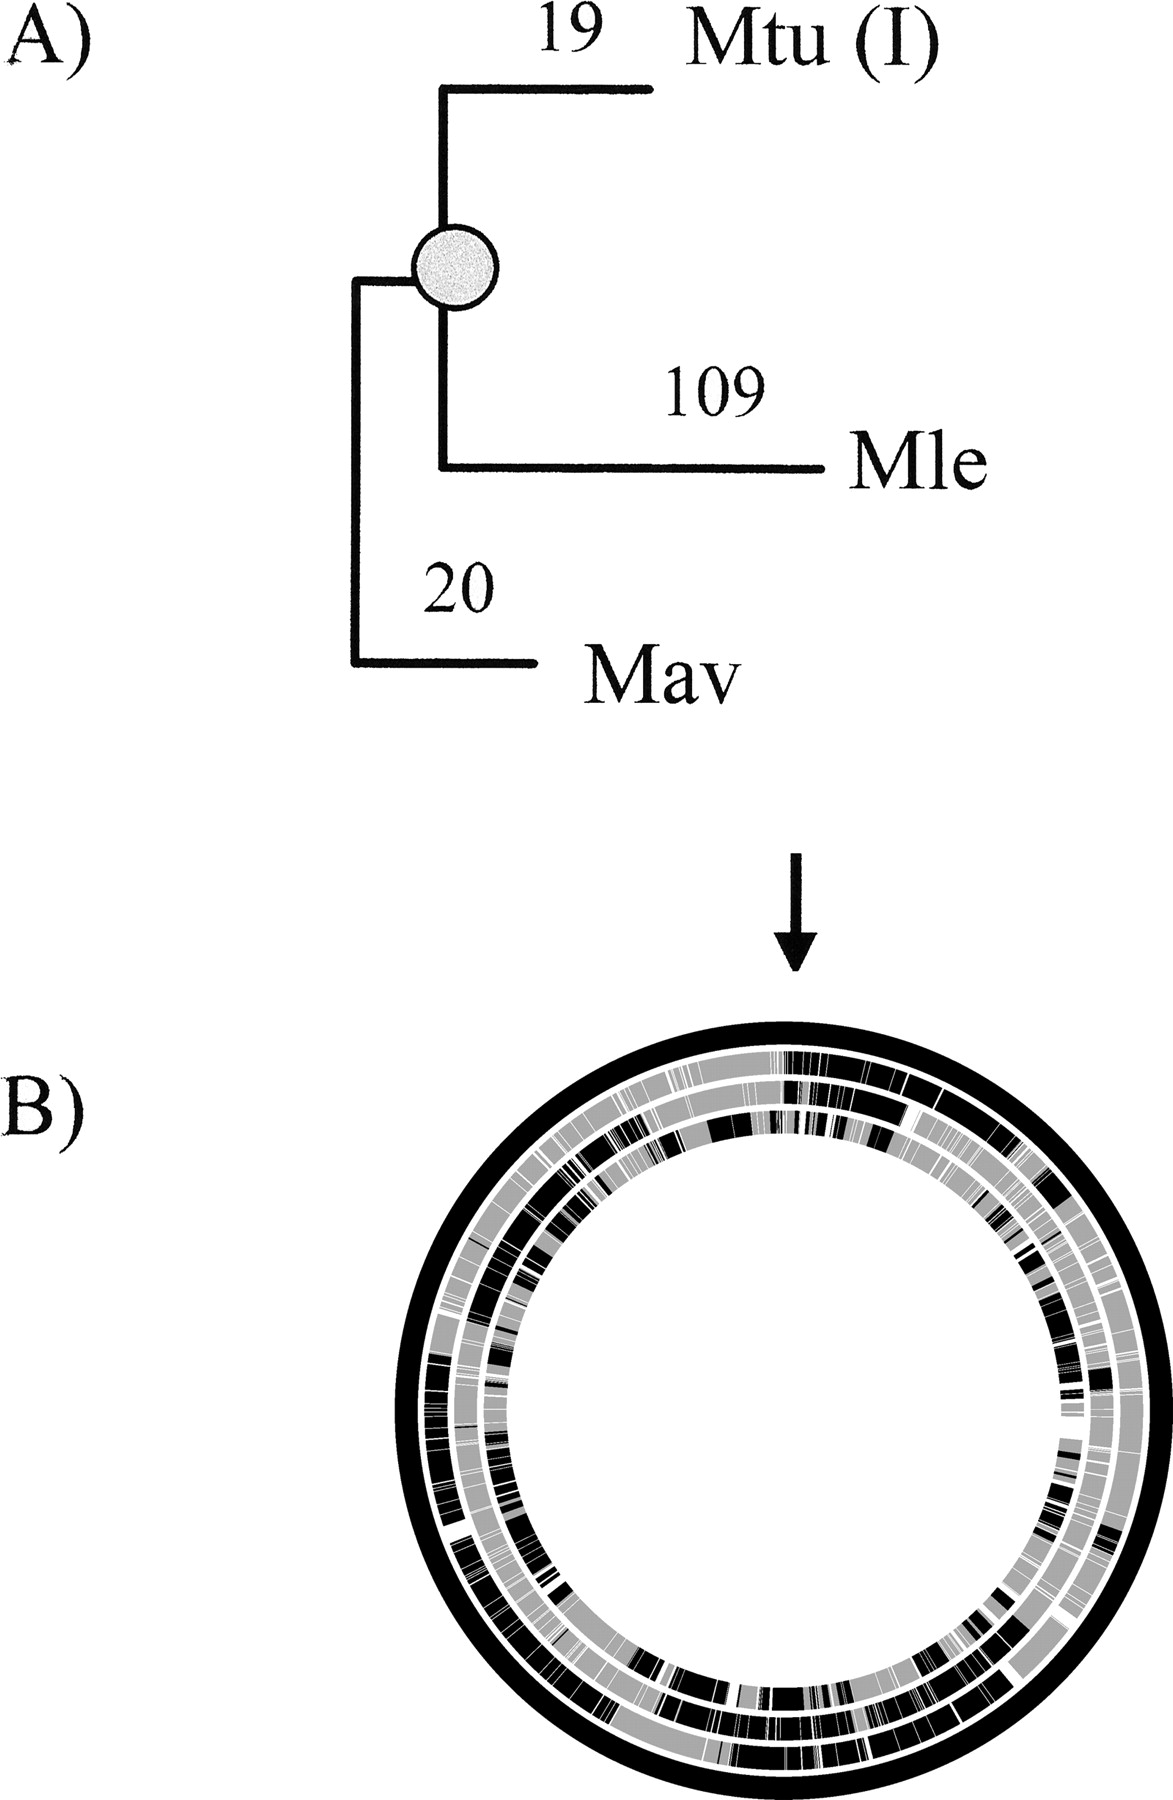
Figure 2.
Chromosomal rearrangements between Mav, Mtu(I), Mle, and the ancestor’s genome. (A) Number of breakpoints from the ancestor’s genome to each species used. The position of the ancestor’s genome is marked with a shaded circle. (B) Graphic representation of the genome rearrangements. From the outside: ancestor, Mav, Mtu(I), and Mle. White spaces represent absent genes in the corresponding genome. The black line in the ancestral genome and in the genomes of Mav and Mtu(I) (top, marked by the arrow) corresponds to two genes of unknown order in the ancestor. Each change of color from dark to light gray indicates a breakpoint.


