
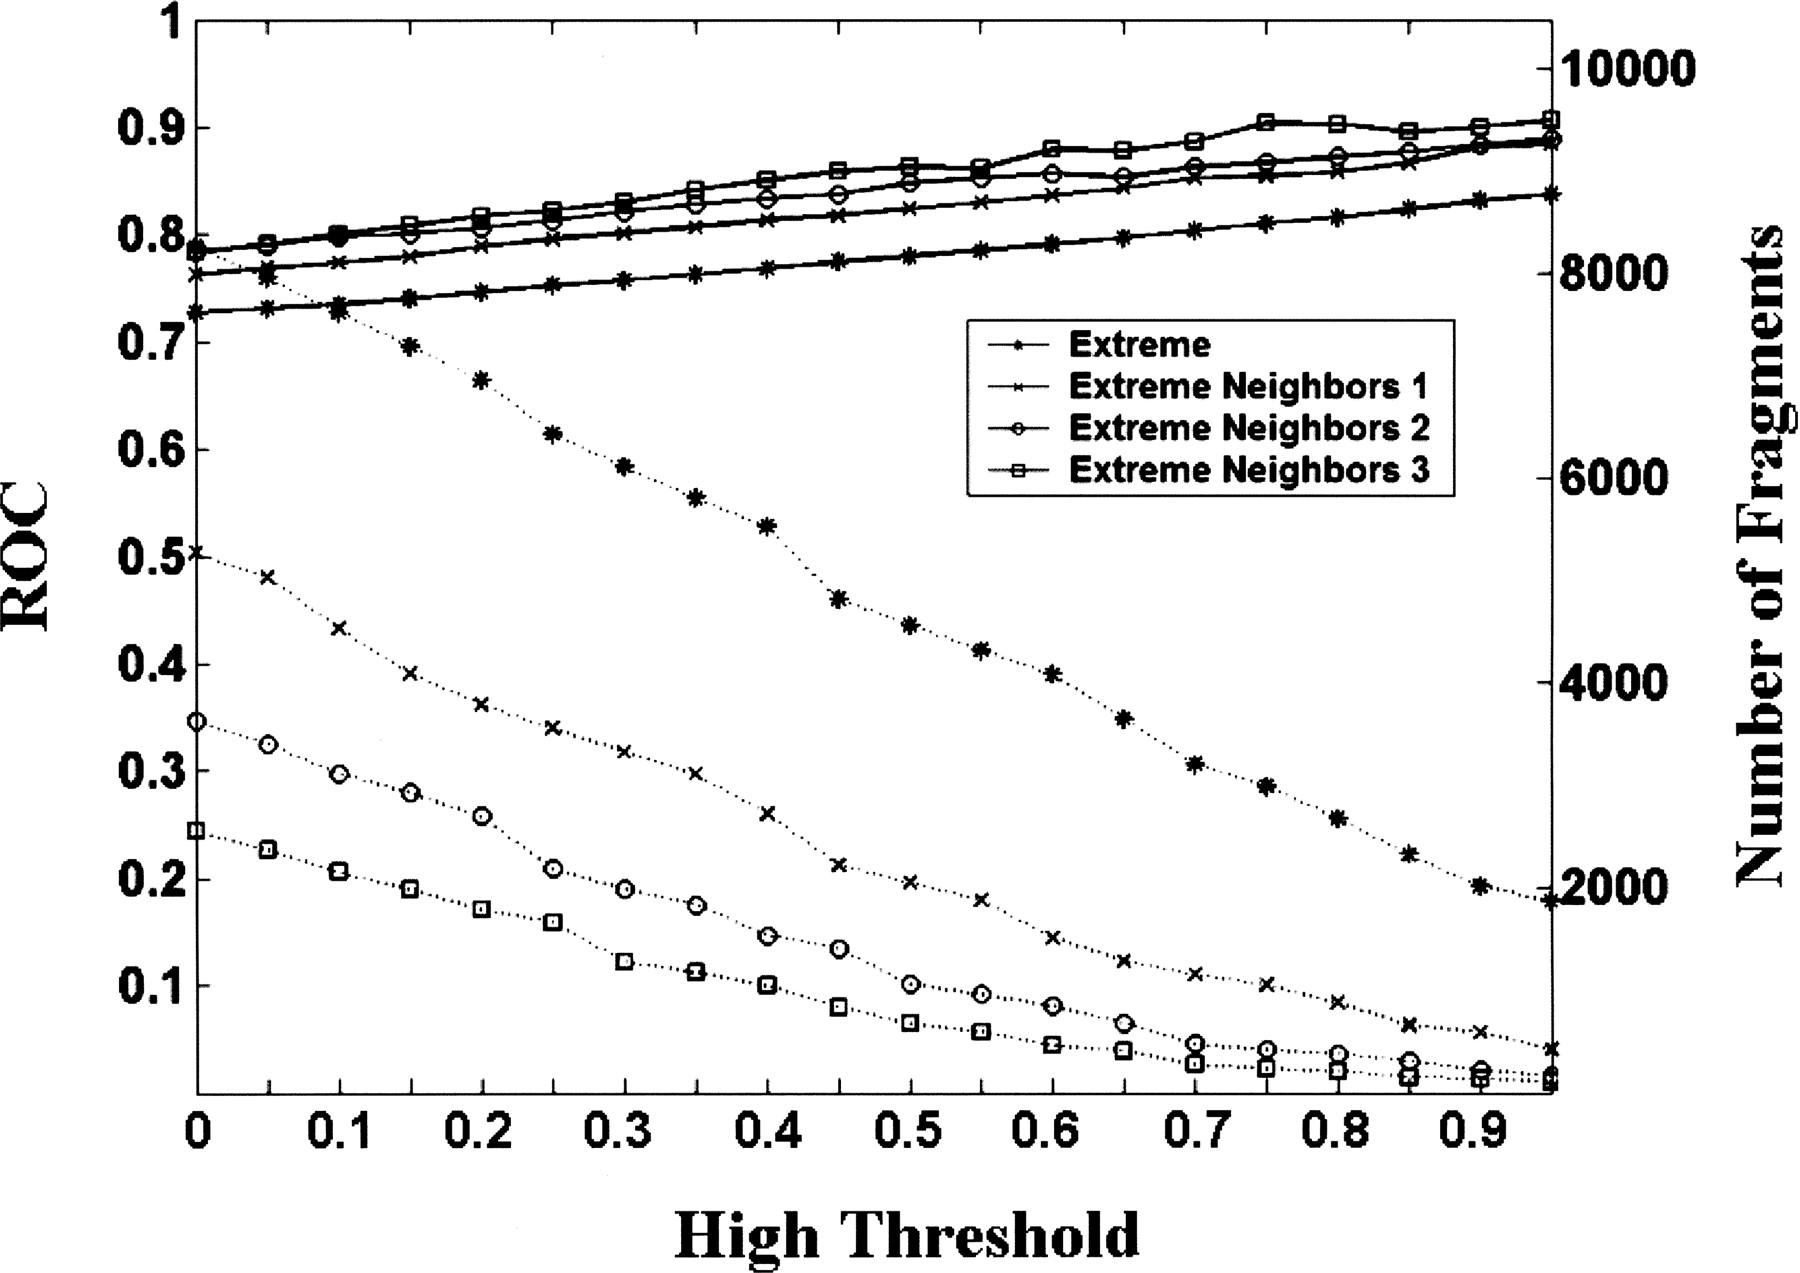
Figure 4.
The number of fragments in the test set and the corresponding ROC score achieved under the extreme and extreme neighbor conditions. The X-axis represents 0.05 increments in the high threshold, Th. Within each increment of Th, increments of 0.05 from 0.00 to −2.00 of the low threshold, Tl, are computed, and the highest ROC score from these increments is selected. For example, the highest ROC score achieved between a Th of 0 and a Tl between 0.00 and −2.00 is 0.73 from 8264 fragments. The left and right Y-axes represent the ROC score (solid lines) and the number of fragments in the test sets (dashed lines), respectively.


