
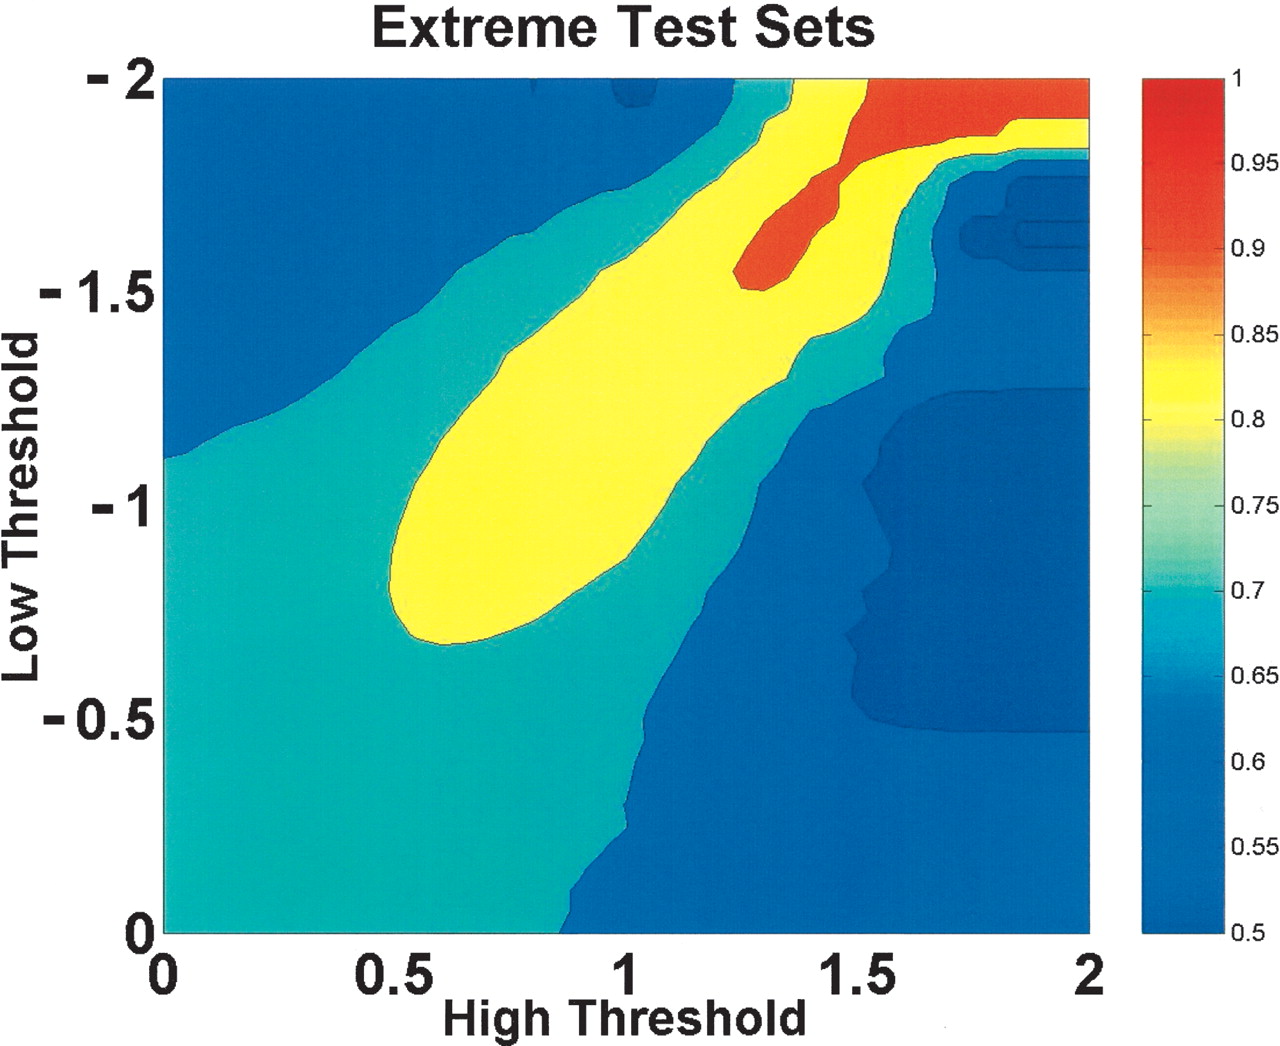
Figure 3.
The fragments with the strongest nucleosome forming and inhibiting signals are the most accurately predicted within the test set. The X- and Y-axes are the high and low threshold values of the predicted scores of the fragments, respectively. The colors on the contour plot represent the ROC score. For example, at (0, 0) all the fragments in the test set are included and have a ROC score of 0.71, while at (1, −1) only the fragments in the test set with predicted scores ≥1 or ≤−1 are included and have a ROC score of 0.83.


