
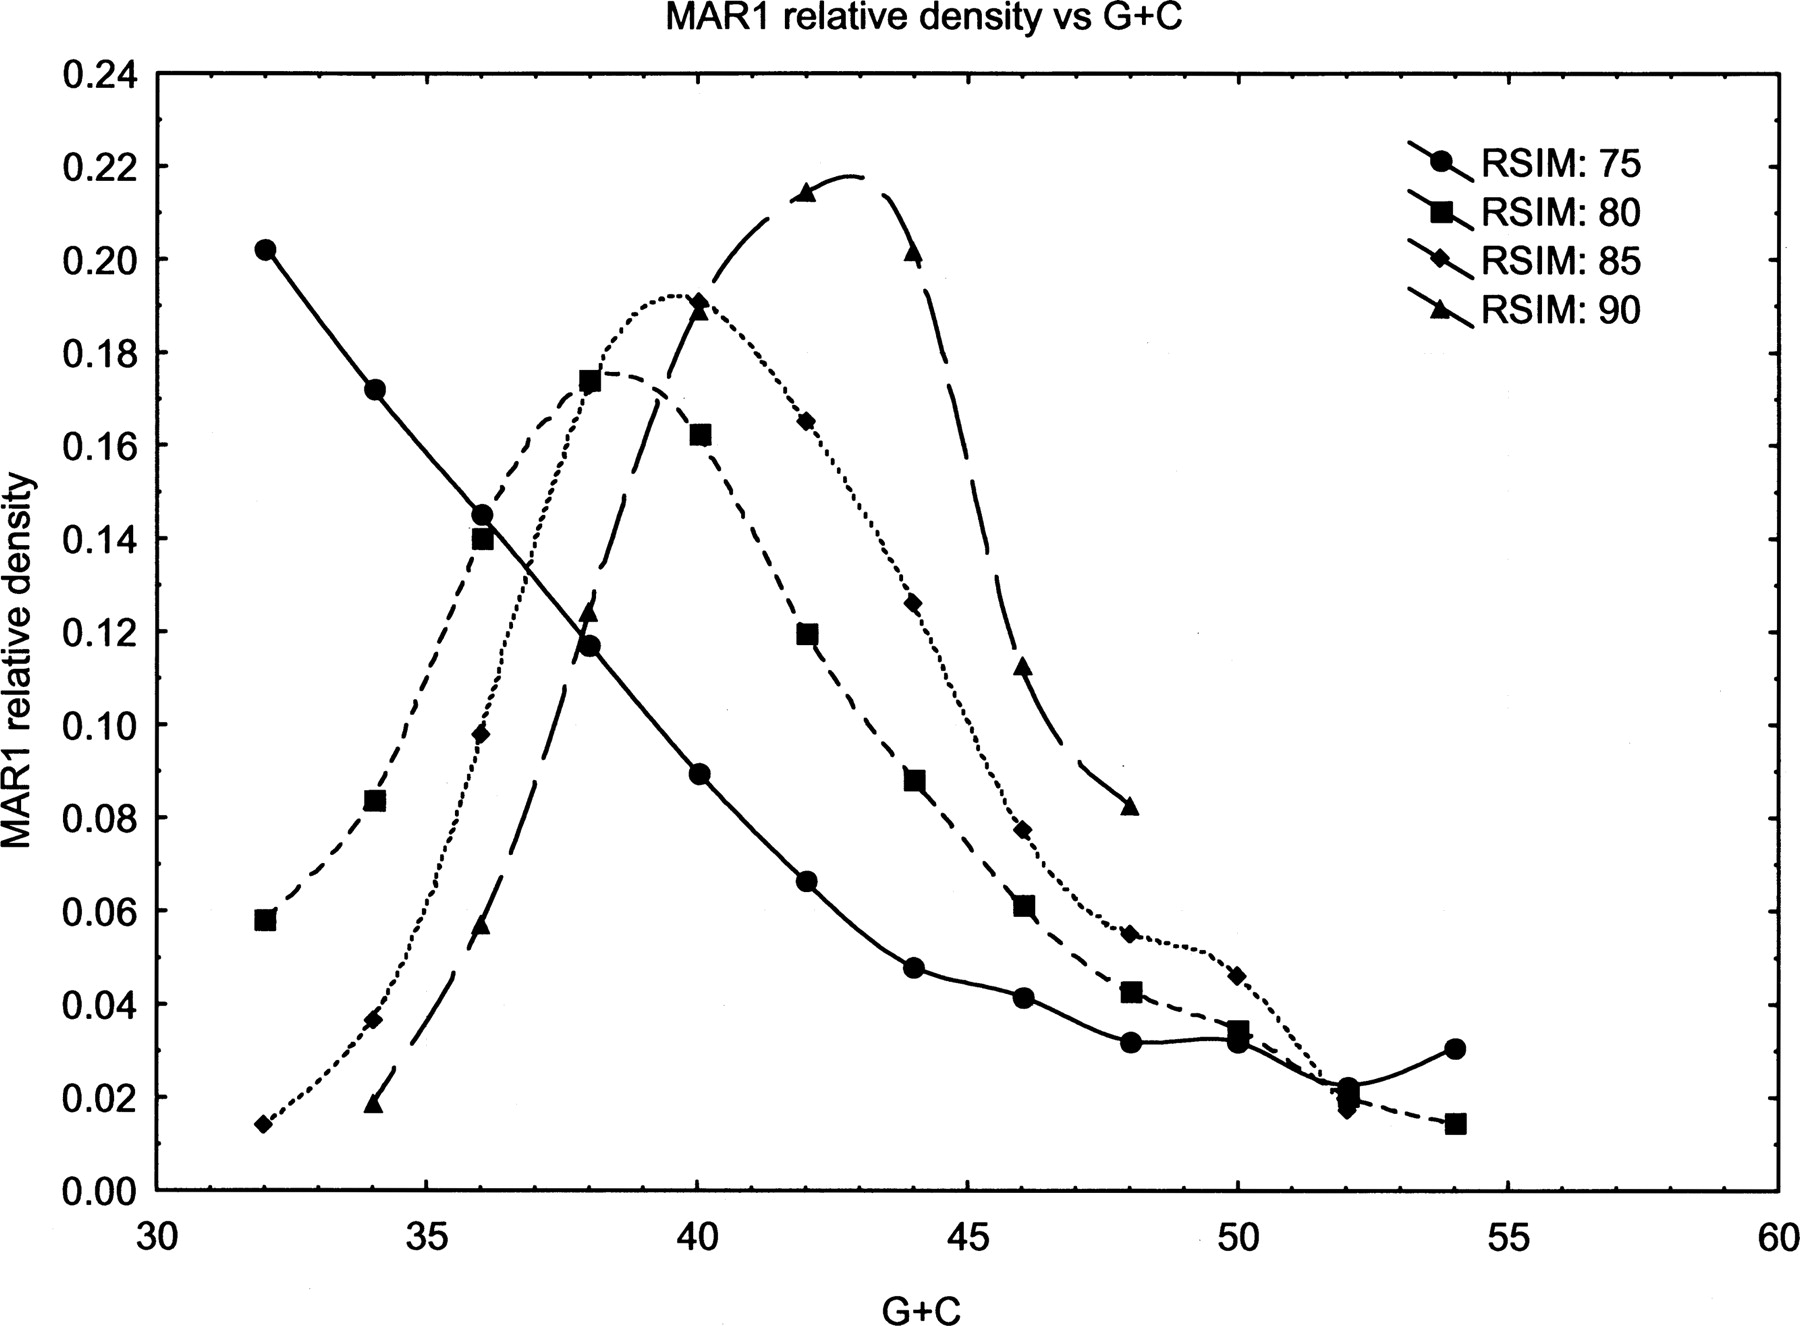
Figure 4.
Distributions of the RTE-mobilized SINE MAR1 across G+C ranges in Monodelphis. Distribution across G+C regions of the Monodelphis genome of MAR1 (putatively RTE-3 -mobilized). The horizontal axis shows G+C content in 5% bins, while the vertical axis shows the normalized densities of the TEs in that bin. For each TE, we categorized elements by age according to their similarity to their consensus sequence (“RSIM” in the legend) and plotted the distribution separately for each. RSIM = 70% indicates similarity to the consensus of 70%–75%, RSIM = 75% indicates 75%–80%, etc. Normalization of TE densities is described in Methods.


