
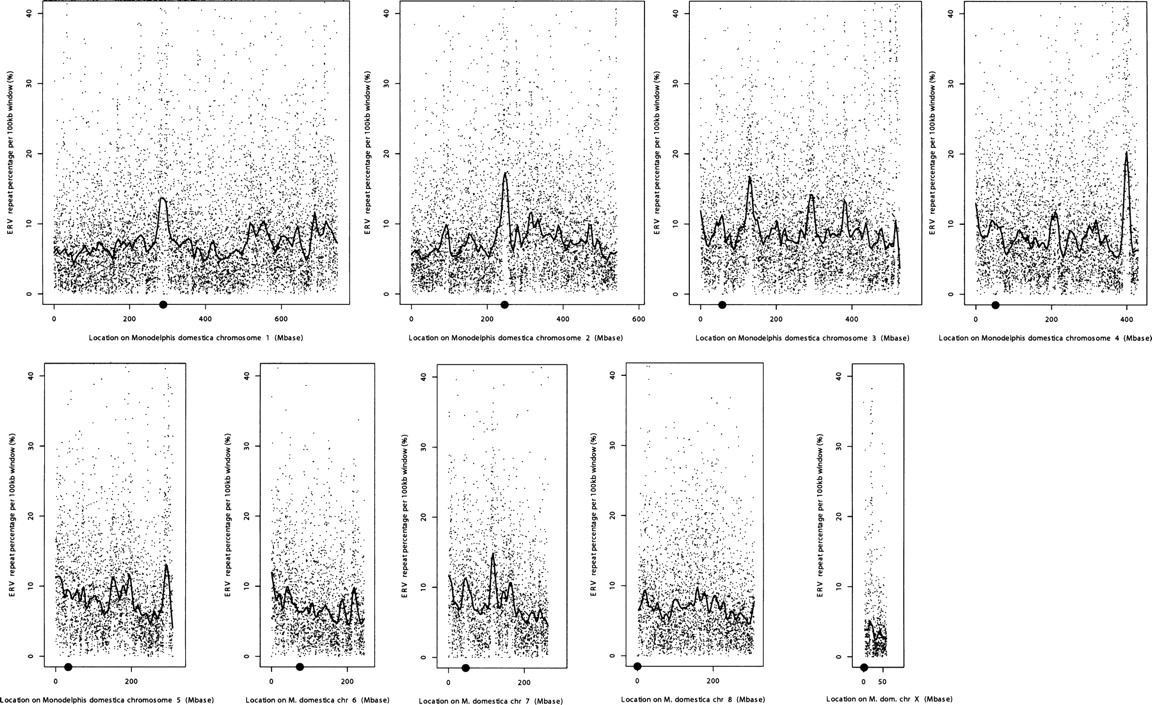
Density of ERV insertions across Monodelphis chromosomes. The density shown is the percentage of sequence that is identified as internal ERV or LTR sequence in 100-kb segments spanning each chromosome. Centromere positions (determined from FISH data, see text) are indicated by a gray circle on the horizontal axis. Position along chromosomes is shown in megabases. The gray dots are values for each individual 100-kb segment. Black lines are a smoothed running mean. Peaks in ERV density on chromosomes 1 and 2 correspond to centromere locations. Prominent peaks are also found on chromosomes 3–5, but do not correspond to centromeric regions in the genome assembly (Mikkelsen et al. 2007); however, they are roughly consistent with locations of cytologically determined centromere activity reported in the literature (Rens et al. 2003).


