
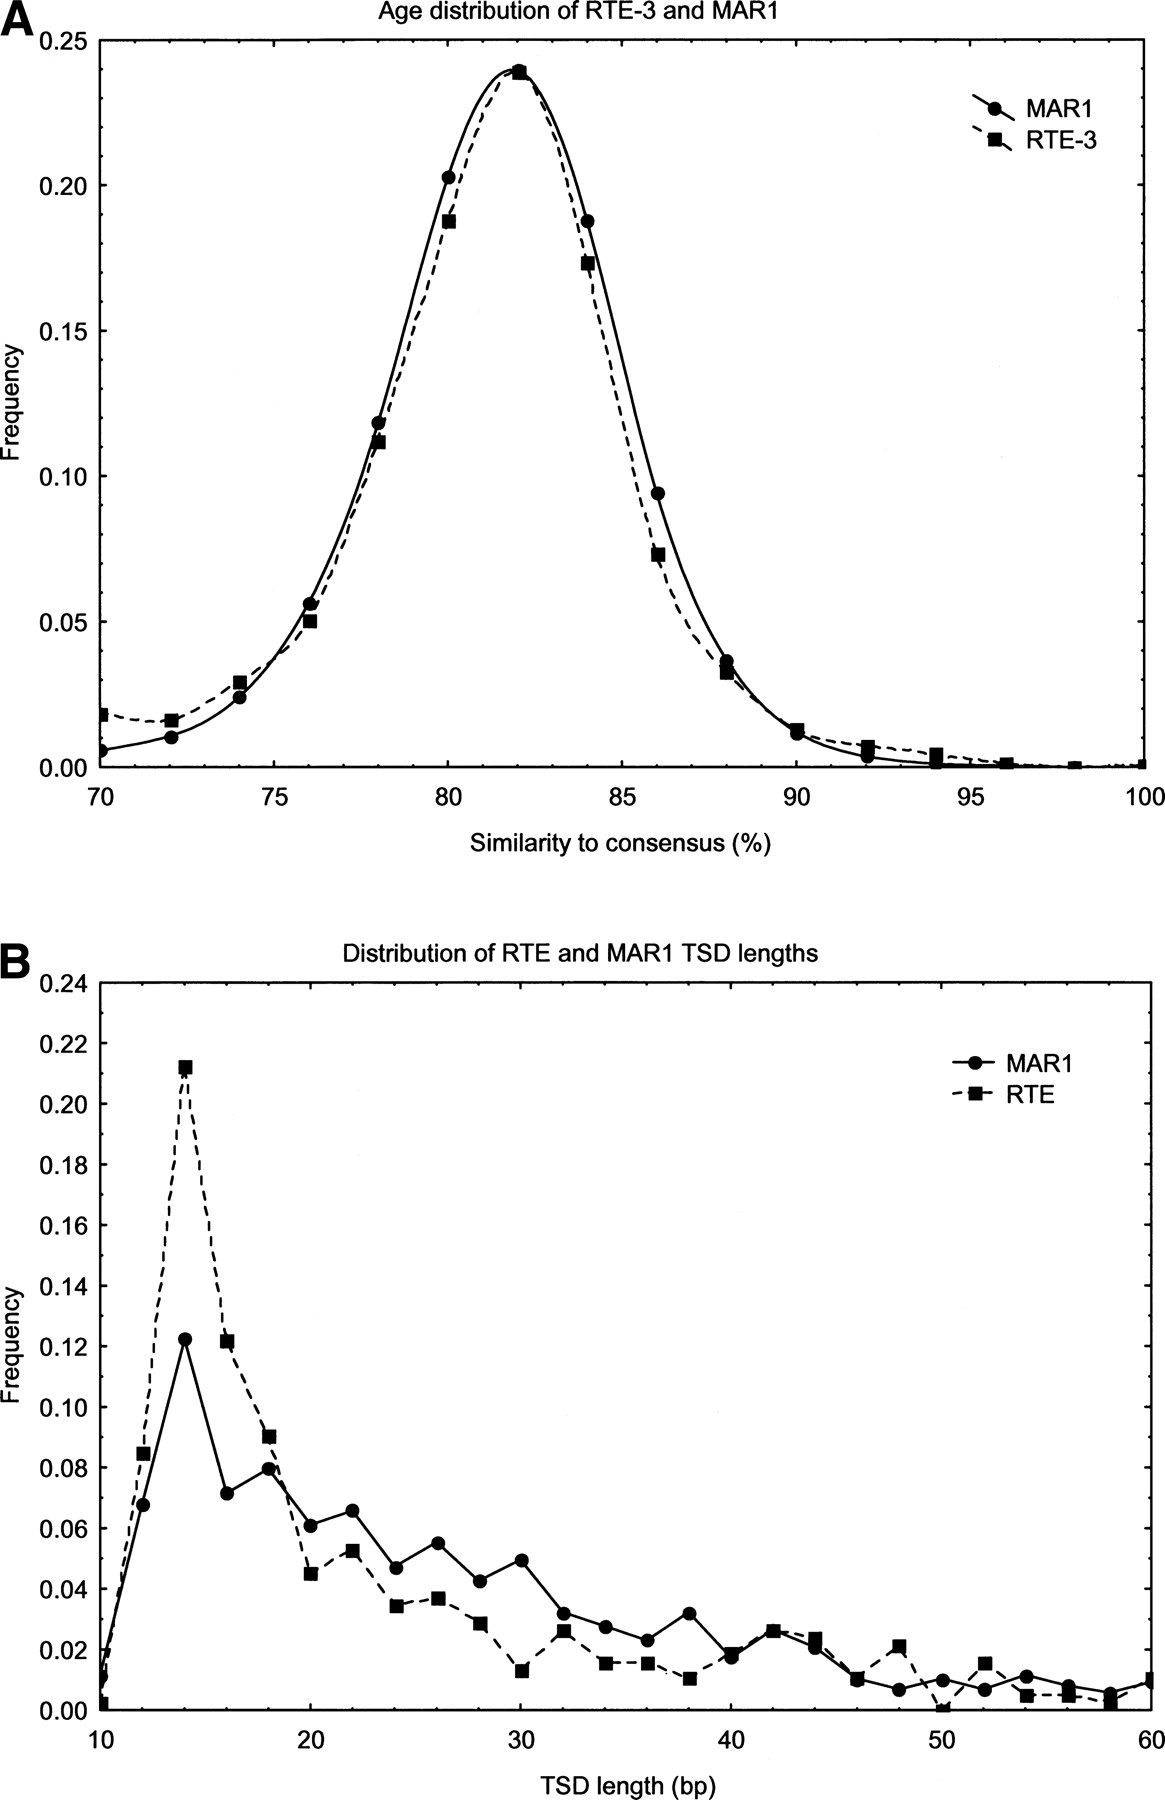
Figure 1.
(A) Age distribution of RTE-3 and MAR1. RTE-3 and MAR1 insertions were separately split into groups according to their similarity to consensus, in bins of width 2% (horizontal axis). The vertical axis shows the proportion of RTE-3 (MAR1) elements of that age, calculated as the number of base pairs of sequence covered by elements in that similarity range divided by the total genome base pairs covered by RTE-3 (MAR1). (B) Distribution of target site duplication lengths of RTE-3 and MAR1. Length of target site duplication is shown on the horizontal axis. The vertical axis shows the frequency of TSDs of that length for RTE-3 and MAR1.


