
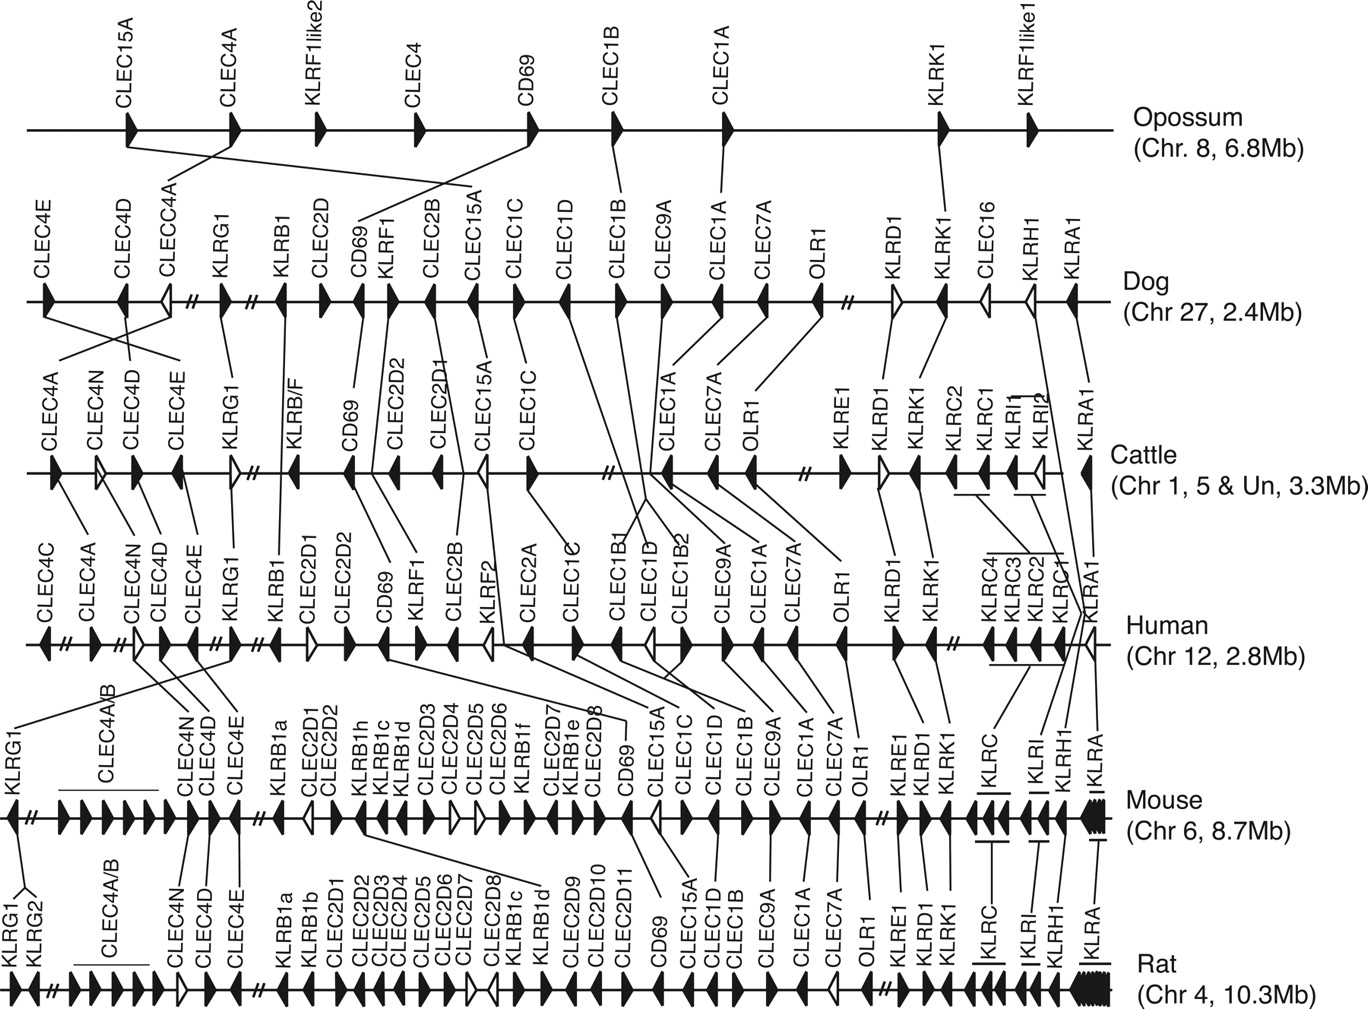
Figure 4.
Comparative map showing opossum and eutherian NKC gene organization (modified from Hao et al. 2006). Arrows show transcriptional orientation. Pseudogenes are shown in white and putative functional genes in black.


